Research Article - Der Pharma Chemica ( 2024) Volume 16, Issue 4
Validated Stability Indicating Method for Estimation of Methoxsalen in Its Formulation By HPLC Analysis
Saumayata Khobragade, Apurva Wasnik, Krishna Gupta* and Milind UmekarKrishna Gupta, Department of Pharmaceutical Chemistry, Smt Kishoritai Bhoyar College of Pharmacy, New Kamptee (MS)-441002, India, Email: krg1903@gmail.com
Received: 12-Jan-2024, Manuscript No. DPC-24-140940; Editor assigned: 17-Jan-2024, Pre QC No. DPC-24-140940 (PQ); Reviewed: 31-Jan-2024, QC No. DPC-24-140940; Revised: 17-Jul-2024, Manuscript No. DPC-24-140940 (R); Published: 05-Aug-2024, DOI: 10.4172/0975-413X.16.4.367-374
Abstract
Aim: The current study concentrates on the kinetics and behaviour of Methoxsalen in solution state drug degradation.
Background: Information from stress testing can subsequently be utilized to create manufacturing procedures or choose the best packaging. It also aids in the preparation of reference data for degradation products that are unknown.
Stress testing is frequently repeated as manufacturing techniques, product composition and analytical procedures are modified and brought to a more final condition, even though pre-formulation work is a necessary component of early phase drug development.
Objective: The study’s design involves selecting an RP-HPLC method for drug estimation followed by assessments of the kinetics of drug degradation, shelf-life estimation and validation of the method.
Methods: Methoxsalen was analyzed for stress degradation in tablet dosage form using the Shimadzu HPLC series 1100. The Agilent ZORBAX SB-C8 (4.6 cm × 150 mm) (5 μm) column was used for the analysis, with acetonitrile:1.28 mM phosphate buffer (pH 5.0) in a ratio of 60:40 v/v as the mobile phase. The analysis was carried out at the 248 nm wavelength, with a flow rate of 1.0 ml/min at which the drug showed a sharp peak. With a 20 μl injection volume, the isocratic pump mode was used for the analysis. The mobile phase was used as diluent. Over the concentration range of 2 to 10 μg/ml, the proposed technique was proved to be linear. The analysis was carried out by placing the standard in an oven at 50ºC for intervals of 30, 60, 90, 120, 150 and 180 minutes with acidic, alkaline, oxidative hydrolytic solutions and for thermal degradation the standard taken in oven at 50ºC for 48 hours.
Results: The results were found to be highly susceptible in acid, alkaline, oxidative hydrolysis and at higher temperature. The order and kinetics of degradation study was calculated from the result obtained.
Conclusion: The proposed method was successfully used for its assay, drug degradation (stress testing) and degradation kinetics in solution state since it was shown to be specific, selective and robust.
Keywords
Methoxsalen; HPLC; Stress degradation studies; Kinetics of solution state degradation studies; Shelf-life estimation
Introduction
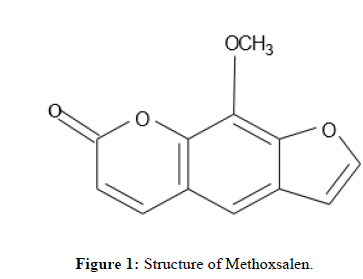
Methoxsalen is an anti-psoriatic medication that is also referred to as xanthotoxin or 8-methoxypsoralen. It is obtained from Ammi majus, a plant in the Apiaceae family [1-3]. The IUPAC name for Methoxsalen is 9-methoxy-7H-furo[3,2-g] chromen-7-one. C12H8O4 is its empirical formula [4,5]. Psoriasis is a long-term condition where skin cells proliferate excessively due to an overly active immune system. Inflammatory and scaly patches of skin appear on the knees, elbows and scalp most frequently, but they can also affect other regions of the body [6].
A review of the literature indicates that there are no official publications on the estimate of Methoxsalen in a single dosage form or on the forced degradation investigations regarding Methoxsalen. Furthermore, it demonstrates that while spectrophotometry, HPLC, LC-MS/MS and comparative studies of HPLC are published for the quantification and characterization of Methoxsalen, no HPLC method is provided for the study of degradation kinetics. Furthermore, hyphenated procedures have not been published for the estimation of shelf-life or the evaluation of degraded samples [7-14].
Therefore, the purpose of this research is to create a simple, accurate stability indicating method for HPLC formulation based Methoxsalen determination and to validate the method in accordance with ICH Stability guideline Q1A (R2) (Figure 1) [15].
Materials and Methods
Instruments
UV-Visible spectrophotometer Jasco V-630, Shimadzu HPLC 1100 series chromatograph equipped with isocratic pump LC-10ADVP, PDA-SPD M20A detector, pH meter (EI, model no. 111E), sonicator (PCI Mumbai, model no. 3.5 L 100H), weighing balance (analytical CAS-44, Shimadzu AUX220), filtration unit (membrane filter, Whatman filter paper 0.45 μ), oven (Tempo-model no. 1536, thermotech-TIC-4000N) and calibrated glassware’s.
Chemicals and reagents
Methoxsalen (brand name-melanocyl), Methoxsalen RS, acetonitrile (HPLC), methanol (HPLC), orthophosphoric acid (GR), potassium dihydrogen phosphate (GR), disodium hydrogen phosphate (GR), hydrochloric acid (GR), sodium hydroxide (GR), potassium permanganate (GR), double distilled water.
Preparation of mobile phase
Preparation of phosphate buffer pH 5.0: Dissolve 6.8 g of phosphate dihydrogen phosphate in 1000 ml of double distilled water and adjust the pH to 5.0 with orthophosphoric acid.
Preparation of mobile phase: The mobile phase was prepared by mixing acetonitrile and 1.28 mM phosphate buffer (pH 5.0) in ratio of 60:40 v/v. each solution was sonicated before use.
Preparation of stock solution
Standard stock solution: Accurately weighed quantity of about 10.0 mg of Methoxsalen was transferred in 10.0 ml volumetric flask, dissolved in a sufficient quantity of mobile phase and dilute it to produce a standard stock of 1000 μg/ml.
Working stock solution: A 1.0 ml of stock solution was transferred to 10.0 ml of volumetric flask and volume was made up to the mark with mobile phase to get final concentration 100 μg/ml.
Working standard solution: The working stock solution was appropriately diluted with mobile phase to get the final concentration of 10 μg/ml.
Diluent: Mobile phase (ACN: 1.28 mM phosphate buffer 60:40 v/v).
Experimental
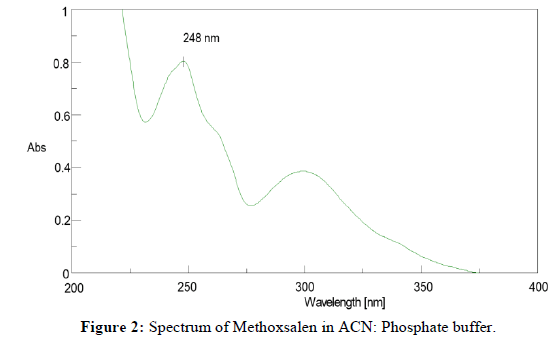
Selection of analytical wavelength: 400 nm-200 nm and the spectra was recorded (Figure 2) and absorbance was observed at 248 nm.
Preliminary optimization of mobile phase and other chromatographic conditions: Optimization of mobile phase was done by preparation of standard solutions of drug in different mobile phases varying in composition and various trials were taken for the selection of mobile phase, column, flow rate, wavelength, temperature and pH. In trial with ACN: Phosphate buffer pH-5.0 with ratio of 60:40 v/v the sharp peak was observed with retention time of 4.49 min with chromatographic condition was selected. Table 1 shows the optimized mobile phase and chromatographic parameters.
| Parameters | Condition |
|---|---|
| Column | Agilent ZORBAX SB-C8 (4.6 × 150 × 5 µm) |
| Mobile phase | ACN: 1.28 mM phosphate buffer pH5 (60:40) |
| Flow rate | 1.0 mL/min |
| Injection volume | 20 µl |
| Detection wavelength | 248 nm |
| Column temperature | 30°C-35°C |
| Pump mode | Isocratic |
Table 1: Optimized chromatographic parameters.
Study of system suitability parameter: The system suitability parameters were studied and after equilibration of column with mobile phase, working stock solution 1.0 ml portion was further diluted to 10ml to get the concentration about 10 μg/ml, six replicate injections of 20 μL solution were injected through the manual injector and the chromatograms were recorded and the peak area was measured. The % RSD was found to be 0.63 which is less than 2%. Hence system suitability was confirmed (Table 2).
| Sr. no | Different conditions | Unexposed std AUC (mV) | Time (min) | Exposed standard (mV) | % Drug undegraded standard |
|---|---|---|---|---|---|
| 50°C | 50°C | ||||
| 1 | Acid hydrolysis (0.5 N HCl) | 997602 | 90 | 788428 | 79 |
| 120 | 745892 | 74.76 | |||
| 150 | 660581 | 66.21 | |||
| 180 | 620240 | 62.17 | |||
| 2 | Alkali hydrolysis (0.01 N NaOH) | 90 | 921670 | 92.38 | |
| 120 | 857408 | 85.94 | |||
| 150 | 787636 | 78.95 | |||
| 180 | 627870 | 62.93 | |||
| 3 | Oxidative hydrolysis (0.001% KMnO4) | 90 | 660581 | 66.21 | |
| 120 | 644292 | 64.58 | |||
| 150 | 620240 | 62.17 | |||
| 180 | 604716 | 60.61 | |||
| 4 | Thermal degradation | 48 h | 914572 | 91.68 |
Table 2: Observation and results of stress degradation of standard at 50°C in different conditions.
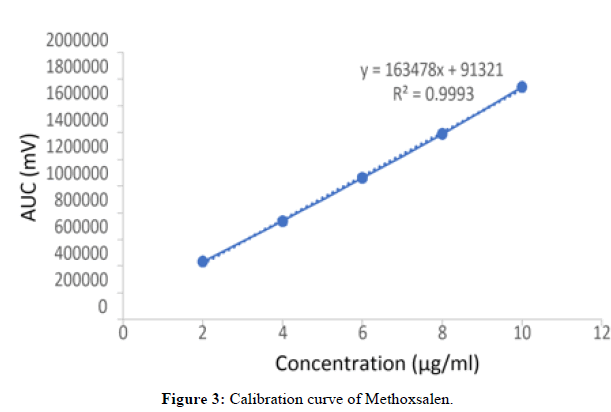
Study of calibration curve: Appropriate aliquots of standard stock solution in range of 0.2 to 1.0 mL were transferred in series of 10 mL volumetric flask and volume was made up to mark with diluent to obtained concentration ranging from 2 μg/mL-10 μg/mL of Methoxsalen respectively. Each of the final solution was injected separately and recorded the chromatograms. The graph was plotted between concentrations vs. AUC.
Stressed degradation studies
General procedure for preparation of standard drug solution: Accurately weighed quantity of Methoxsalen (eq. to 5 mg) was transferred to a series of different 10.0 mL volumetric flasks. To each flask 5.0 mL of reagent (acid, alkali and 0.001% potassium permanganate) were added. The flasks were placed in oven at 50°C; samples were withdrawn after 30, 60, 90, 120, 150 and 180 min. To each flask diluent was added and volumes adjust up to mark. A 1.0 ml portion of filtrate was diluted up to 10.0 ml with diluent. The final concentration of solution was 5 μg/ml of Methoxsalen.
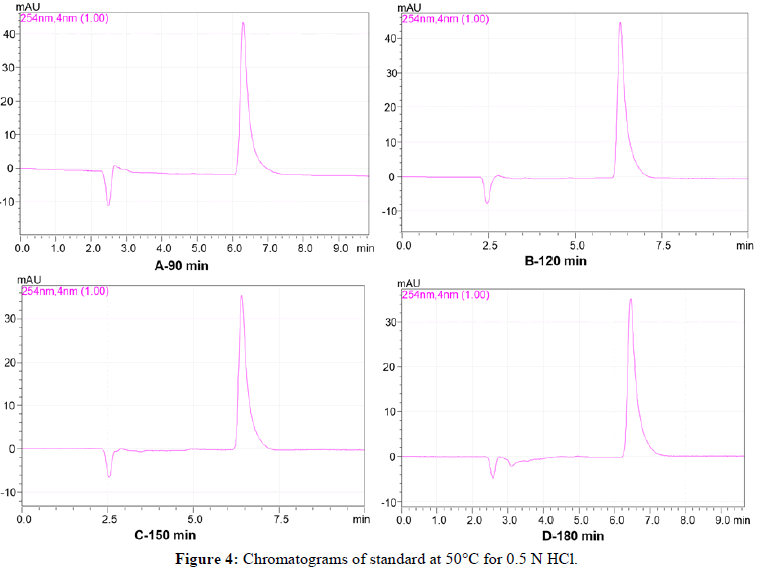
Acid hydrolysis: It was performed by placing standard in 0.5 N HCL solution in oven at 50°C temperature for a period of 30, 60, 90, 120, 150 min and 180 min. The chromatograms of standard Methoxsalen in 0.5 N HCL at 50°C Figure 4.
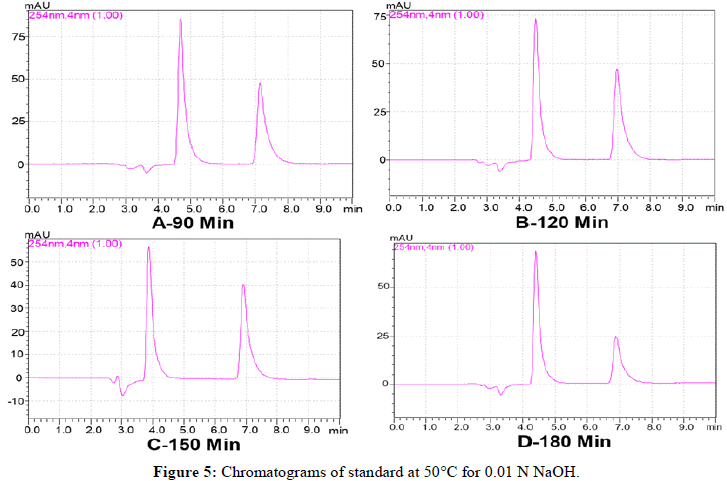
Alkali hydrolysis: It was performed by placing standard in 0.01N NaOH in oven at 50°C for a period of 30, 60, 90, 120, 150 and 180 min. The chromatograms of standard Methoxsalen with 0.01 N NaOH at 50°C (Figure 5).
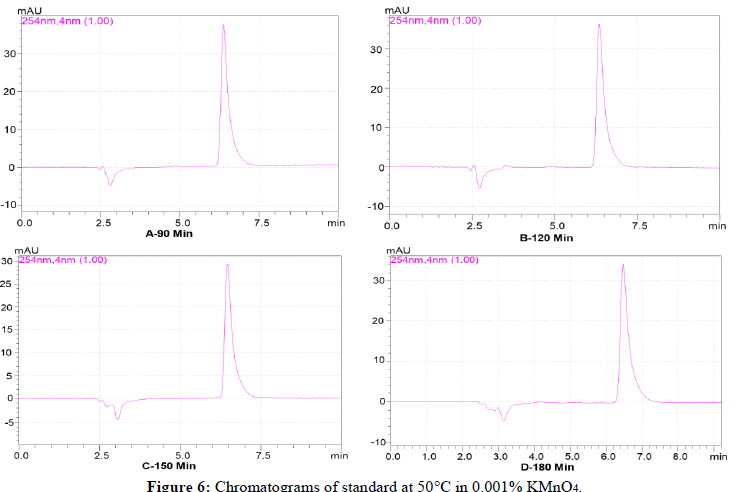
Oxidative hydrolysis: It was performed by placing standard in 0.001% KMnO4 in oven at 50°C for an interval of 30, 60, 90, 120, 150 and180 min. The standard solutions were injected and chromatographed separately using optimized chromatographic conditions. The chromatograms of standard Methoxsalen with 0.001% KMnO4 at 50°C (Figure 6).
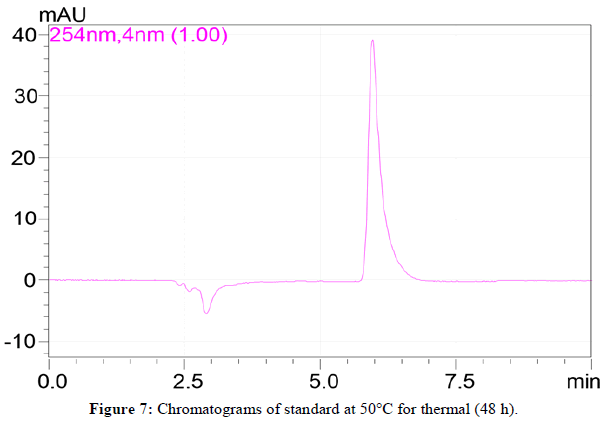
Thermal degradation: The thermal degradation was performed by placing standard with oven temperature 50°C for 48 hrs. The standard solutions were injected and chromatographed using optimized chromatographic conditions. The chromatograms of standard Methoxsalen at oven temperature 50°C (Figure 7 and Table 3).
| Sr. no. | Conditions | Order (50°C) | Rate constant, k (50°C) | Half-life t1/2 (50°C) (Min) | Shelf life t90 (50°C) (Min) |
|---|---|---|---|---|---|
| Standard | Standard | Standard | Standard | ||
| 1 | 0.1 N HCL | Zero | 1.05 × 10⁻² | 237.87 | 47.57 |
| 2 | 0.01 N NaOH | Zero | 1.03 × 10⁻² | 242.95 | 48.59 |
| 3 | 0.001% KMnO4 | Second | 7.22 × 10⁻⁴ | 277 | 30.47 |
Table 3: Result of degradation kinetics, order, half-life and shelf life.
Assay method for marketed formulation
Twenty tablets were weighed and powdered. A quantity of power containing equivalent to 5.0 mg of Methoxsalen was weighed and transferred to 10.0 mL of volumetric flask, sonicated for 15 min with sufficient quantity of diluent (mobile phase) and volume was made up to mark with diluent. The content of flask was filtrate through 0.45 μm filter paper A 1.0 mL portion of the filtered was further diluted to 10.0 mL with diluent (50 μg/mL). After that 1.0 mL portion of the dilution was further diluted to 10.0 mL with diluent (5 μg/mL). After equilibration of stationary phase, five sample solutions were injected separately and chromatogram were recorded. The content of Methoxsalen in each sample was calculated by comparing the peak area of sample with that of standard and the results are showed in Table 4.
| Study | Mean of % label claim | ± SD | % RSD | Inference |
|---|---|---|---|---|
| % Assay | 101.116 | 0.192 | 0.19 | Pass |
| % Recovery | 100.04 | 0.58 | 0.58 | Pass |
| Intraday precision | 100.95 | 0.065 | 0.064 | Pass |
| Inter day precision | 101.16 | 0.242 | 0.239 | Pass |
| Robustness | - | Pass | Pass | Pass |
| Ruggedness | Pass | |||
| LOD (µg) | 0.15 | |||
| LOQ (µg) | 0.48 | |||
Table 4: Summary of results of estimation and validation parameters.
Kinetics of solution state degradation studies: The kinetics of degraded sample was evaluated for all hydrolytic conditions like acidic, alkali, oxidative and at 50°C temperatures, a reduction of drug concentration in standard according to the time of exposure to stress could also be observed.
Validation of proposed method
Validation of the proposed method was carried out as per ICH guideline.
Accuracy: Accuracy of the proposed method was ascertained on the basis of recovery studies performed by standard addition method. Results are shown in Table 4.
Precision: Precision of estimation of Methoxsalen by proposed method was ascertained by replicate analysis of homogeneous samples of tablets. Results are shown in Table 4.
Intermediate precision
The sample was prepared as per procedure described under marketed formulation and analyzed at intervals of ½ h up to 3 h for intraday study and on 1st, 3rd and 5th day for inter-day study. The content of Methoxsalen was calculated and results obtained for intraday and inter day studies are found to be shown in Table 4.
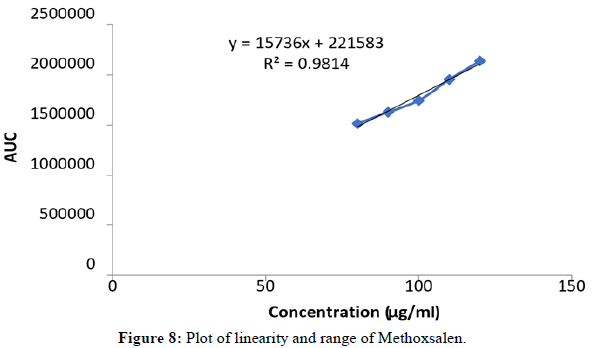
Linearity and range: An accurately weighed tablet powder equivalent to 80, 90, 100, 110 and 120% of label claim as described under marketed formulation. The plot of concentration vs. AUC so plotted was found to be linear and is shown in Figure 8.
Robustness: Deliberate change was made in the optimized chromatographic parameters and robustness of the method was studied by evaluating system suitability parameter data after varying the flow rate, detection wavelength, pH of mobile phase and mobile phase composition. The observation so recorded are shown in Table 4.
Ruggedness: Analyst to analyst study.
The tablet samples were analyzed using proposed method by two different analysts and the sample preparation was done as per the general procedure described earlier. The results are shown in Table 4.
Limit of detection and limit of quantification: The standard deviation of Y-intercept and slope of calibration curves were used to calculate the LOD and LOQ for all the drugs using following formulae LOD=3.3 (σ)/S and LOQ=10 (σ)/S. The results are recorded in Table 4.
Results and Discussion
Stress degradation studies
Acid hydrolysis: The chromatograms of standard Methoxsalen in 0.5 N HCL at 50°C Figure 4 reveals that the drug was found to be degraded up to 38% in 3 hrs. No additional peaks were seen in chromatogram.
Alkaline hydrolysis: The chromatograms of standard Methoxsalen in 0.01 N NaOH at 50°C. Figure 4 reveals that the drug was found to be degraded up to 37% in 3 hrs. Additional peak were seen in chromatogram. As per USP (United State Pharmacopeia) the impurity reported elute after the drug peak. The relative retention time are about 2.1 for impurity and 1.0 for Methoxsalen. But, in our study in basic hydrolysis (0.01 N NaOH) the extra peak was observed before the drug peak and relative retention time was found 0.64 indicating a new unknown impurity.
Oxidative hydrolysis: From chromatograms of standard Methoxsalen in 0.001% KMnO4 at 50°C. Figure 4 reveals that the drug was found to be degraded up to 39% in 3 hrs. No additional peaks were seen in chromatogram.
Thermal degradation: The chromatograms of standard Methoxsalen at oven temperature 50°C. Figure 4 it reveals that the drug was found to be degraded up to 8%. The chromatogram was observed slightly broader.
Kinetics of solution state degradation studies
The plot of regression coefficient (r) obtained and the best fit observed indicates the order of degradation reaction. The results are depicted in Table 3. From the order of reaction, the half-life and shelf life of the standard was calculated.
Method validation
Assay (Method precision): In the assay of Methoxsalen in dosage form, the %RSD was found to be 0.190 and results of % assay shown in Table 4.
Validation parameters
% Recovery (Accuracy): The % recovery (Accuracy) was carried out by Standard addition method. In case of sample the % recovery was found to be between 98%-100% in Methoxsalen. The % RSD was found to be 0.5856 and the result of % recovery shown in Table 4.
Linearity and range: The Linearity study indicates the linearity of area under curve of drug over the range of 80%-120% of label claim of dosage form. For the drug in formulation the percent concentration of drug (LC) vs. area under curve plot shows a linear relationship with correlation coefficient close to 1. The result and graph of linearity and range studies shown in Table 4 and Figure 8.
Precision intermediate precision: The precision was carried out by inter-day and intraday variations, the % RSD of Methoxsalen was found to be 0.239 to 0.0644 respectively. The result of precision studies shown in Table 4.
Robustness: The robustness of the method was evaluated by evaluating the system suitability parameter data after varying individually the detection wavelength, composition of mobile phase and flow rate of the mobile phase in optimize condition and the results were found to be within limit.
Ruggedness: The ruggedness was carried out by analyst-to-analyst variation, the % RSD of Methoxsalen was found to be 0.53 to 0.22 respectively. the result of ruggedness study shown in Table 4.
Limit of detection and limit of quantification: The LOD and LOQ of the method were evaluated for Methoxsalen by evaluating the standard deviation and slope data from calibration curve parameter. LOD and LOQ were found to be 0.15 μg and 0.48 μg respectively. The summary of results of assay and validation parameters is shown in Table 4.
Conclusion
From the results obtained by RP-HPLC and kinetics study of the samples it can be concluded that the proposed method was successfully applied for its assay, degradation (stress testing) of drug and degradation kinetics in solution state. The method was found to be accurate, precise, rugged and robust. The drug was found to be highly susceptible towards acidic hydrolysis, basic hydrolysis, oxidative hydrolysis and at high temperature. From the results obtained by RP-HPLC and kinetics study of the samples it can be concluded that investigating of suitable storage conditions for Methoxsalen should consider the influence of temperature.
References
- Jamatia T, Das S, Das MK. J Pharm Innov. 2023; 18(4): p. 2305-2324.
- Liu S, Cheng R, He H, et al. Arch. Biochem Biophy. 2023; 741: p. 109617.
[Crossref] [Google Scholar] [PubMed]
- Unde S, Kurup N. Indian J Pharm Educ Res. 2021; 55(2): p. 572.
- Bakshi H, Nagpal M, Singh M, et al. Curr Drug Saf. 2020; 15(2): p. 82-104.
[Crossref] [Google Scholar] [PubMed]
- Elkhawaga OY, Ellety MM, Mofty SO, et al. Inflammo Pharmacol. 2023; 31(3): p. 1183-1198.
[Crossref] [Google Scholar] [PubMed]
- Lv Z, Ouyang H, Zuo F, et al. Biomed Chromatogr. 2024; 38(5): p. 5847.
[Crossref] [Google Scholar] [PubMed]
- Yang SY, Lu MX, Zhang YQ, et al. J Sep Sci. 2023; 46(10): p. 2202-2053.
[Crossref] [Google Scholar] [PubMed]
- Darmwal J, Joshi P, Koshyari V, et al. Indian J Nat Prod Resour. 2024; 15(1): p. 122-134.
- Wozniak L, Połaska M, Marszalek K, et al. Molecules. 2020; 25(17): p. 3805.
[Crossref] [Google Scholar] [PubMed]
- Javaid A, Anwar S, Ali Z, Naseem S. Int J Agric Sci. 2021; 25(03): p. 677-682.
- González-Gonzalez O, Ramirez IO, Ramirez BI, et al. Pharmaceutics. 2022; 14(11): p. 2324.
[Crossref] [Google Scholar] [PubMed]
- Sahu PK, Ramisetti NR, Cecchi T, et al. J Pharm Biomed Anal. 2018; 147: p. 590-611.
[Crossref] [Google Scholar] [PubMed]
- Blessy MR, Patel RD, Prajapati PN, et al. J Pharm Anal. 2014; 4(3): p. 159-165.
[Crossref] [Google Scholar] [PubMed]
- Bhaskar R, Ola M, Agnihotri V, et al. J Drug Deliv Ther. 2020; 10(2): p. 149-155.
- John P, Azeem W, Ashfaq M, et al. B Chem Soc Ethiopia. 2015; 29(1): p. 27-39.

