Research Article - Der Pharma Chemica ( 2024) Volume 16, Issue 4
Synthesis, Charactrization and Antibacterial Activity of Schiff Bases Derived from Phenyl Hydrazine Derivatives and their Cu (II) and Zn (II) Complexes
Tesfaye Lamma, Adelew Filkale, Dagne Addisu Kure and Henok Brehanu Abebe*Henok Brehanu Abebe, Department of Chemistry, College of Natural and Computational Sciences, Hawassa University, P.O. Box 05, Hawassa, Ethiopia, Email: henokbre@hu.edu.et
Received: 12-Jul-2024, Manuscript No. DPC-24-141750; Editor assigned: 17-Jul-2024, Pre QC No. DPC-24-141750 (PQ); Reviewed: 31-Jul-2024, QC No. DPC-24-141750; Revised: 01-Aug-2024, Manuscript No. DPC-24-141750 (R); Published: 29-Aug-2024, DOI: 10.4172/0975- 413X.16.4.375-394
Abstract
Phenyl hydrazine schiff bases have received a lot of attention recently because of their biological importance and potential medical applications. These compounds are of particular interest because they have a variety of beneficial properties, including antibacterial, anticancer, antimalarial, antiinflammatory, antinociceptive, antitubercular, anthelmintic, antidiabetic and antiepileptic. In this research, phenyl hydrazine derivatives of Schiff base ligands namely ((E)-2-benzylidene-1-phenylhydrazine, (E)-2-(4-nitrobenzylidene) phenyl hydrazine, 2,2'-((1E, 1‘E)-hydrazine-1,2-diylidenebis (methanylylidene)) diphenol and (E)-2-(2-hydroxybenzylidene)-1-phenylhydrazine) and their copper(II) and zinc(II) complexes were synthesized and described. The synthesized ligands, were characterized by varieties of techniques including Fourier transform Infrared, UV-Visible and NMR (13C-NMR and 1H-NMR) spectroscopies. The complexes were synthesized via the reactions of ligands with the corresponding metal acetates in a medium of methanol which were then characterized by UV-Vis and IR spectroscopies. In-vitro antibacterial activity of the ligand and metal complexes were carried out against three bacteria species E. coli, Staphylococcus aureu and Pseudomonas aeruginosa by disc diffusion method. The antibacterial activity shows that the copper (II) complex (TCO8) the highest activity against bacteria than the Zn (II) metal complexes and the free ligand. The minimum inhibitory concentration of the Cu(II) complex (TCO8) demonstrated excellent antibacterial activity varies from 5 μl/ml-10 μl/ml, against S. auras, E. coli, P. aeruginosa with inhibition zone of 21 mm, 16 mm, 11mm respectively, using ciprofloxacin as a standard drug.
Keywords
Mixed ligand metal complexes; Phenyl hydrazine Schiff base; Phenyl hydrazine; Antibacterial activity; Minimum inhibitory
concentration; Zn(II) Schiff bases complex; Cu(II) Schiff base complex
Introduction
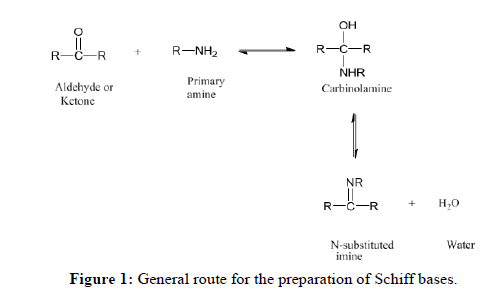
Among the many ligand systems that can be found in the chemical literature, Schiff base ligands play an important role and are well known in the syntheses of varieties of complexes. Complexes of Schiff-base ligands have attracted tremendous interest mainly due to their high stability, activity and variability [1]. Late transition metal (II) ions derived from the appropriate salts form stable complexes when mixed with Schiff base ligands. Structurally, a Schiff base is a nitrogen analogue of an aldehyde or ketone (Figure 1) in which the Carbonyl (CO) has been replaced by an imine or azomethine group [1,2].
Nowadays active and well-designed Schiff base ligands are considered privileged ligands ‘as they are able to coordinate many different metals and stabilize them in various oxidation states, enabling the use of Schiff base metal complexes for a large variety of useful catalytic and biological activities [3]. A large number of Schiff base ligands are able to coordinate many elements and stabilize them in various oxidation states. Recently, Schiff bases have been known to be used in the preparation of many potential drugs and are known to possess a broad spectrum of biological activities such as antiviral, antifungal, antiparasitic, antibacterial, anti-inflammatory, antitumor, anti HIV, anticancer etc. [4]. Transition metal complexes of Schiff bases, especially the first raw transition metal Schiff base complexes [5], likewise, display a wide range of significant pharmacological [6] and catalytic importance [7]. Eight of the first raw transition metals have biological roles in human [8] and 5 of them namely manganese, iron, cobalt, zinc and copper are essential nutrients [9]. Copper and zinc are crucial for the normal functioning of our body as both are involved in various vital roles in biological systems with copper being important in the synthesis of myoglobin, myelin, melanin and for the strengthening of the skin, epithelial and connective tissue, while the later mainly involved as cofactors for the catalytic activities of more than 200 enzymes [10]. In this article, we reported the synthesis, characterization and antibacterial activity of four Schiff base ligands and the corresponding complexes of Cu (II) and Zn (II). All the synthesized ligands and complexes were characterized using varieties of spectroscopic techniques before their biological activities were tested.
Materials and Methods
Experimental sections
Chemicals: The chemical that was used for experiment were phenyl hydrazine, anhydrous sodium sulphate, p-nitro benzaldehyde, salicylaldehyde (99%), benzaldehyde, absolute ethanol (99.8%), ethyl acetate (99.9%), copper (II) acetate, zinc (II) acetate, N-hexane (99.9), methanol (99.8%), chloroform (99.8%), dichloromethane, glacial acetic acid (99.8%), DMSO and Silica gel GF-60-200 mesh, acetone, all of them are analytical grade reagent were parched from Ran-chem. plc, Addis Ababa.
Apparatus and instrument: Nuclear Magnetic Resonance (NMR) analysis were recorded on a Bruker 400 MHz spectrometer with tetramethylsilane as internal standard; CDCl3 as solvent. Electronic Melting Point apparatus (for determination melting points of the synthesized compounds), oven (model OV150ss, Genlab, Widnes, England) to remove moisture. The synthesized organic compounds were visualized by irradiation with UV light at (254 nm and 365 nm), molar conductance of the complex in DMSO will recorded at room temperature with JENWAY 4510 conductometry, the electronic (UV-Vis) absorption spectra was measured on a spectroscopic GENESY S 2PC UV-Vis spectrophotometer in the range of 200 nm-800 nm regions in DMSO, infrared (KBr pellet) spectrum was recorded on Perk-Elmer BX infrared spectrometer in the range 400 cm-1-4000 cm-1. All the Spectral analyses were carried at the department chemistry, Addis Ababa university.
Experimental procedure
The synthesis of the desired ligands bearing different substituent and their Zn (II) and Cu (II) complexes were attempted and their structures were characterized by using a variety of spectroscopic techniques including UV-Vis, Infrared (IR) and Nuclear Magnetic Resonance (NMR) spectroscopy.
Synthesis of Schiff base ligands
Preparation of Schiff base (TL1): (600 mg, 5.5 mmol) of phenyl hydrazine and (706.6 gm, 4.44 mmol) benzaldehyde (1:1.2) ratio were dissolved in ethanol and placed in 100 ml round bottom flask and refluxed in the presence of glacial acetic acid for 14 hr with constant stirring. The progress of the reaction was monitored by using TLC by using n-hexane and ethyl acetate (90:10) solvent system. After completion of the reaction, the product was extracted by dichloromethane and adsorbed by anhydrous sodium sulfate and purified by column chromatography using n-hexane: ethyl acetate (85:15) solvent system. Finally, the purified product, a deep brown solid, was formed with yield 76%.
Preparation of Schiff base (TL2): Salicyaldehyde (600 mg, 5.5 mmol) and hydrazine hydrate (706.6 gm, 4.44 mmol) (i.e., 1:2 ratio) were dissolved in ethanol and added in 100 ml round bottom flask and refluxed in the presence of glacial acetic acid for 10hr with constant stirring. The progress of the reaction was monitored by using TLC in n-hexane and ethyl acetate (90:10) solvent system combination. After completion of the reaction, the product was extracted by dichloromethane and adsorbed by anhydrous sodium sulfate and purified by column chromatography using hexane:Ethyl acetate (90:10) solvent system. Finally, a purified yellowish solid product was obtained with yield 68%.
Preparation of Schiff base (TL3): Salicylaldehyde (1.35 mg, 11.1 mmol) were dissolved in 30 ml of ethanol and mixed with (1000 mg, 9.2 mmol) of phenyl hydrazine in 100 ml round bottom flask. Then the reaction mixtures were refluxed in the presence of glacial acetic acid for 12 hr. The progress of the reaction was monitored by using TLC in n-hexane and ethyl acetate (90:10) solvent system. After completion of the reaction, the product was extracted by ethyl acetate. Then, after collecting and drying, the product was further purified by column chromatography (using hexane:Ethyl acetate (90:10) solvent system. The purified solution was concentrated and light yellow crystal product was obtained with yield 65%.
Preparation of Schiff base (TL4): Phenyl hydrazine (1000 mg, 9.25 mmol) and P-nitrobenzenaldehyde (1.678 gm, 11.11 mmol) with ratio of (1:1.2) were dissolved in ethanol and added in 100 ml round bottom flask and refluxed in the presence of glacial acetic acid for 8 hrs with constant stirring. The progress of the reaction was monitored by using TLC in n-hexane and ethyl acetate (95:5) solvent system. After completion of the reaction, the product was extracted by ethyl acetate. Then the organic layer was collected and dried by anhydrous sodium sulfate and concentrated using rotary evaporator. Then the collected product was column chromatographically purified and red solid product with 70% Yield was obtained.
Synthesis of Zn (II) and Cu (II) complexes with synthesized Schiff bases
Synthesis of Zn (II) complex (TCO-1) of TL-2 and TL-3: Zn (II) complex of compound TCO-1 was prepared by mixing solution of 380 mg of TL-2 and 519.6 mg TL-3 of ligands in 15 ml hot methanol with solution of 507 mg of zinc (II) acetate 5 ml of hot methanol by keeping ligand-metal ratio 2:1. The resulting mixture was stirred and refluxed for 12 hours. The reaction progress was checked by TLC using ethyl acetate: N-hexane (85:15) solvent system. After the completion of the reaction, the solution obtained was cooled in ice bath and product obtained was filtered and washed by methanol. Finally, the precipitate was dried in desiccators overnight and crystallized in ethanol. A white solid was obtained with yield 88.8%.
Synthesis of Zn (II) complex (TCO-2) of TL-2 and TL-4: Zn (II) complex of compound TCO-2 was prepared by dissolving 380 mg of TL-4 and 422 mg of TL-2 of ligands in 15 ml hot methanol with solution of 429.06 mg of zinc (II) Acetate in 15 ml of hot methanol by keeping ligand metal ratio 2:1. The resulting mixture was refluxed for 16 hours. The completion of the reaction was checked by TLC in ethyl acetate:n-hexane (15:85) solvent system. After completion of the reaction, solution obtained was cooled in ice bath and the product obtained filtered and washed by dichloromethane. Finally, the precipitate was dried in desiccators overnight and crystallized and light yellow solid was obtained with yield 69%.
Synthesis of Zn (II) complex (TCO-3) of TL-1 and TL-2: Zn (II) complexes of compound TCO-3 was prepared by dissolving 320 mg of TL-1 and 391.8 mg TL-2 of ligands in 15 ml hot methanol solution with 15 ml of hot methanol solution of 429 mg of zinc (II) acetate keeping ligand-metal ratio 2:1. The resulting mixture was refluxed for 24 hours. The reaction progress was monitored by TLC using ethylacetate:N-hexane (10:90) solvent system. After completion of the reaction, the solution obtained was cooled in ice bath and the product obtained was filtered and washed by dichloromethane. Finally, the precipitate was dried in desiccators overnight and crystallized. A light brown solid was obtained with yield 66.7%.
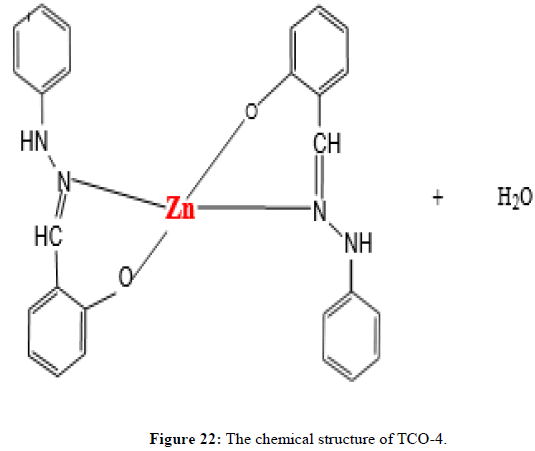
Synthesis of Zn (II) Complex (TCO-4) of TL-3: Zn (II) complex of compound TCO-4 was prepared by dissolving 800 mg of TL-3 in 15 ml hot methanol solution and dissolving 460 mg of Zinc (II) acetate in 15 ml of hot methanol solution keeping ligand-metal ratio 2:1. The resulting mixture was refluxed for 12:15 hours. The reaction progress was monitored by TLC. The completion of the ligand was checked by TLC using ethyl acetate:N-hexane (10:90) solvent system. Finally, the precipitate was dried in desiccators overnight and crystallized in ethanol. The solid product was obtained as yellow solid with yield 72%.
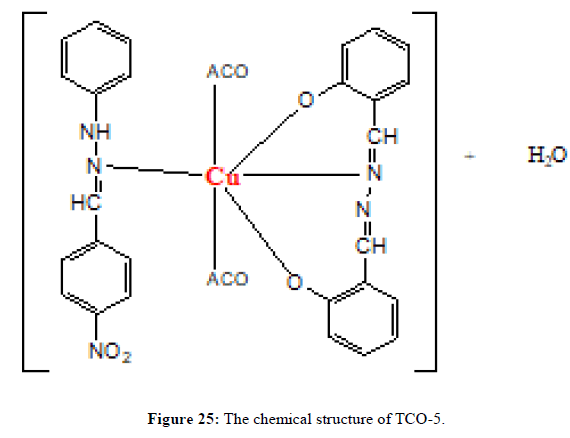
Synthesis of Cu (II) complex (TCO-5) of TL-2 and TL-4: Cu(II) complexes of compound TCO-5 was prepared by dissolving 340 mg of TL-4 and 338 mg TL-2 of ligands in 15ml hot methanol with solution of 15 ml of hot methanol 394 mg of copper (II) acetate by keeping ligand-metal ratio 2:1. The resulting mixture was refluxed for 22 hours. The reaction progress was monitored by TLC using ethyl acetate:hexane (15:85) respectively. After completion of the reaction, the solution obtained was cooled in ice bath and the product obtained was filtered and washed by dichloromethane. Finally, the precipitate was dried in desiccators overnight and crystallized in ethanol. The light green solid was obtained and Yield 71%.
Synthesis of Cu (II) complex (TCO-6) of TL-2 and TL-3: Zn(II) complexes of compound TCO-6 was prepared by dissolving 300 mg of ligand TL-2 and 367 mg of ligand TL-3 in 15 ml hot methanol with 15 ml solution of 427 mg of copper (II) acetate of hot methanol keeping ligand-metal ratio 2:1. The resulting mixture was refluxed for 17 hours. The reaction progress was monitored by TLC using ethyl acetate; hexane (15:85) solvent system. After completion of the reaction, the solution obtained was cooled in ice bath and the product obtained was filtered and washed by dichloromethane. Finally, the precipitate was dried in desiccators overnight and crystallized in ethanol. Dark green Solid was obtained with yield 62%.
Synthesis of Zn (II) complex (TCO-7) of TL-3: Cu (II) complex of compound TCO-7 was prepared by dissolving 800 mg ligand TL-3 in 15 ml hot methanol solution with 15 ml of hot methanol solution of 249 mg of copper (II) acetate by keeping ligand metal ratio 2;1, the result mixture was refluxed for 12:15 hours. The reaction progress was monitored by TLC using ethyl acetate:Hexane (20:80) solvent system. After completion of the reaction, solution obtained was cooled in ice cold water and the product obtained was filtered and washed by dichloromethane. Finally, the precipitate was dried in desiccators overnight and crystallized. Dark green Solid was obtained with yield 80.2%.
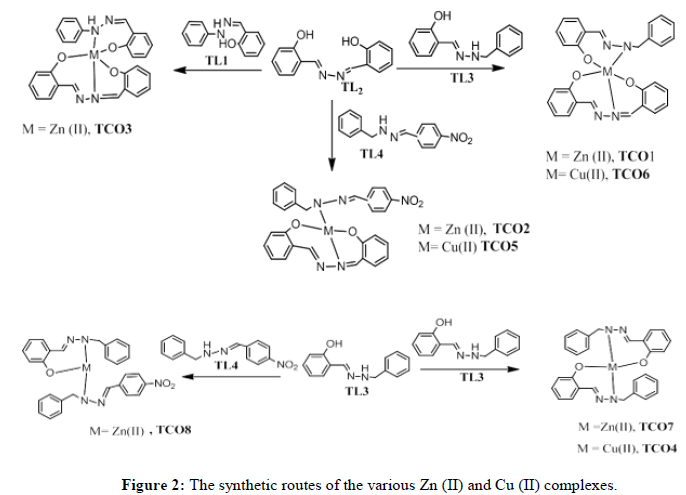
Synthesis of Zn (II) complex (TCO-8) of TL-3 and TL-4: Zn (II) complexes of compound TCO-8 was prepared by dissolving 250 mg of ligand TL-3 and 307.4 mg of ligand TL-4 in 15 ml hot methanol solution with 15 ml solution of 335 mg of zinc (II) acetate in hot methanol keeping ligand-metal ratio 2:1. The resulting mixture was refluxed for 14 hours. The completion of the reaction was checked by TLC in ethyl acetate:N-hexane (20:80) solvent system. A dark red solid was separated by filtration, washed and dried in desiccators and yield was 63.5% (Figure 2).
Characterization of synthesized ligands and complexes
Characterization of the four ligands and their eight Zn (II) and Cu (II) complexes are conducted by employing physical methods like color, solubility at different solvents, melting point, conductance measurements and also spectroscopic methods namely FT-IR, UV-Vis and NMR spectrophotometers. Orion EC112 conductivity bench meter is used for conductance measurement and digital melting point apparatus INE-WRS 2C is used to measure the melting points of all the 12 compounds. For the determination of structures of ligands and complexes, spectroscopic measurements are carried at the chemistry department of Addis Ababa university and the spectra are interpreted by us.
Antibacterial activities
The in vitro microbial screening of the metal complexes against three bacteria species Staphylococcus auras, Escherichia coli and Pseudomonas aeruginosa by were conducted using disc diffusion method [11]. The discs measuring 6 mm in diameter were prepared from Whatman No.1 filter paper sterilized by dry heat at 121°C for 1 h. The stock solutions were prepared by dissolving the compounds in DMSO and the degrees of bactericidal activities are determined by measuring diameter of inhibition zone and comparing them with the standard drugs ciprofloxacine. After incubation period, the growth inhibition zones in diameters are carefully measured in mm. The clear zone around the wells was measured as inhibition zones.
Preparation of chemical solution and media for the antibacterial activity: Preparation of solution was carried out using analytical balance (PR204-alumin (200 g × 0.1 mg) to measure 5 mg and then, the extract was mixed with 100 μl DMSO to form a homogenous solution. A 5 μl and 10 μl of solution were added to the sterile disk prepared using sterile micropipette to know if there is a difference in the volume of the solution added on the disk. Quality control strains obtained from Hawassa university college of medicine and health science was inoculated on nutrient agar plate using sterile loop. The plate was incubated for 24 hours at 37°C. A 3-5 colonies was picked and suspended in 5 ml nutrient broth to make 0.5 McFarland standards. From the suspension by using sterile swab deepen and swab on Muller Hinton agar plate in three directions to form uniform inoculum. Then a disk with a control ciprofloxacin and solution impregnated disk was placed on the plate and incubated for 24 hours at 37°C. Each disk was labeled with its unique ID number on the back of the petri dish. Finally, antibacterial activity of ligands and complexes were measured from zone of inhibition around the disk.
Results and Discussion
Physical characteristics of the synthesized compounds
Solubility test: The synthesized ligands and complexes were tested for their solubility in various solvents with a range of polarity like water, ethyl acetate, methanol, ethanol, chloroform, DMSO and n-hexane. The synthesized ligands and complexes are highly soluble in polar solvents like ethyl acetate and DMSO, partially soluble in methanol and ethanol but insoluble in water and n- hexane as shown in Table 1.
| Compounds | Solvents | ||||||
|---|---|---|---|---|---|---|---|
| Water | Ethyl acetate | Methanol | Ethanol | Chloroform | DMSO | n-hexane | |
| TL1 | X | √ | √ | √ | √ | √ | X |
| TL2 | X | √ | √ | √ | √ | √ | X |
| TL3 | X | √ | √ | √ | √ | √ | X |
| TL4 | X | √ | √ | √ | √ | √ | X |
| TCO1 | X | √ | X | X | * | √ | X |
| TCO2 | X | √ | X | X | * | √ | X |
| TCO3 | X | √ | X | X | * | √ | X |
| TCO4 | X | √ | X | X | * | √ | X |
| TCO5 | X | √ | X | X | * | √ | X |
| TCO6 | X | √ | X | X | * | √ | X |
| TCO7 | X | √ | X | X | * | √ | X |
| TCO8 | X | √ | X | X | * | √ | X |
Note: X: Insoluble *: Partially soluble √: Soluble
Table 1: Solubility of ligands and complexes.
Melting point and conductance measurements: Melting point measurements of synthesized ligands and complexes using an electro thermal melting point apparatus (Gallenkamp) reveled that with the exception of complex TCO-3 having lower melting point (190°C) than ligand TL2 m.p. (193°C), all of the other seven complexes have a higher melting point than any of the ligands and while TCO-5 has the highest melting point, 245°C. The conductivity of the complexes measured at room temperature at a concentration of 10-3 M by the procedure reported by Geary [12] lies in the range of 12-22 ῼ-1 cm2mol-1 suggesting their non-electrolytic nature. The physical parameters like melting point, color, percentage yield and molar conductance of the synthesized ligands and their metal complexes are provided blow (Table 2).
| Compounds | Mol. formula | Mol. wt. | m.p°C | Color | % Yield | Molar conductance |
|---|---|---|---|---|---|---|
| TL1 | C13H12N2 | 196 | 162 | Brown solid | 76 | 9 |
| TL2 | C14H10N2O2 | 238 | 193 | Yellow solid | 68 | 7 |
| TL3 | C13H12N2O | 212 | 187 | Yellow solid | 65 | 8 |
| TL4 | C13H11N3O2 | 231 | 145 | Red solid | 70 | 9 |
| TCO-1 | Zn C27H22N4O3 | 515 | 215 | White solid | 88.8 | 12 |
| TCO-2 | Zn C27H21N5O4 | 534 | 198 | Light yellow solid | 69 | 17 |
| TCO-3 | Zn C27H22N4O2 | 499 | 190 | Brown solid | 66.7 | 22 |
| TCO-4 | Zn C26H24N4O2 | 488 | 226 | yellow solid | 72 | 16 |
| TCO-5 | Cu C27H21N5O4 | 533 | 245 | green solid | 71 | 15 |
| TCO-6 | Cu C27H22N4O3 | 514 | 217 | Greenish dark | 62 | 14 |
| TCO-7 | CuC26H24N4O2 | 487 | 231 | Greenish dark | 80.2 | 19 |
| TCO-8 | Cu C26H23N5O3 | 507 | 205 | Dark red | 63.2 | 18 |
Table 2: Physical properties of the synthesized compounds.
Spectral characterization of the synthesized compounds
The structures of the synthesized products were assessed by interpretation of IR, NMR and UV- visible spectra obtained. The spectroscopic data of IR, 1H-NMR, 13C-NMR, DEPT-135 and UV-Visible are in good agreement with the expected structures of the synthesized compounds. FT-IR spectroscopy provides a useful method in the structural elucidation and analysis of metal chelates [13]. To study binding modes of ligands with metals in the complexes, the FT-IR spectra of the free ligands were compared with the spectra of their metal complexes. While we made all the spectra of the spectroscopic data available in a supporting document, below are Table 3 for important peaks of UV-Vis spectrum and Table 4 for important peaks of IR spectrum of all the 12 synthesized compounds.
| No. | Compound | Solvent | Absorption (nm) | Band assignment |
|---|---|---|---|---|
| 1 | TL1 | DMSO | 303 340 497 |
π → π* n → π* |
| 2 | TL2 | DMSO | 332 | π → π* n → π* |
| 3 | TL3 | DMSO | 296 337 495 |
π → π* n → π* |
| 4 | TL4 | DMSO | 264 412 502 |
π → π* n → π* |
| 5 | TCO-1 | DMSO | 268 333 499 |
π → π* n → π* |
| 6 | TCO-2 | DMSO | 299 352 |
π → π* n → π* |
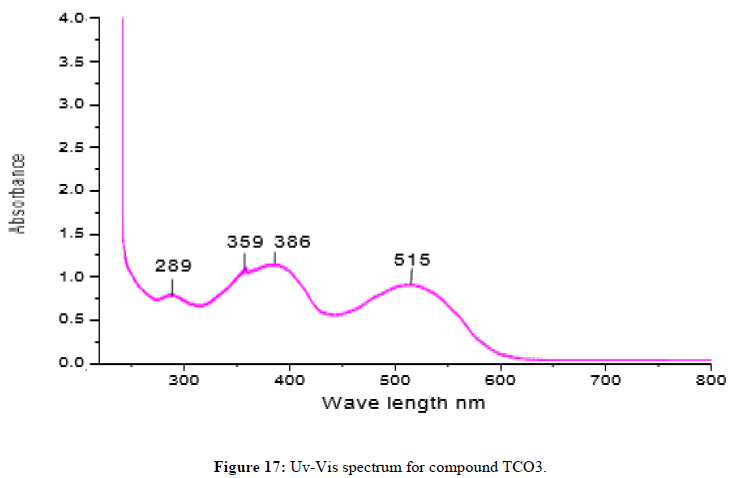
| 7 | TCO-3 | DMSO | 289 356 386 |
π → π* n → π* |
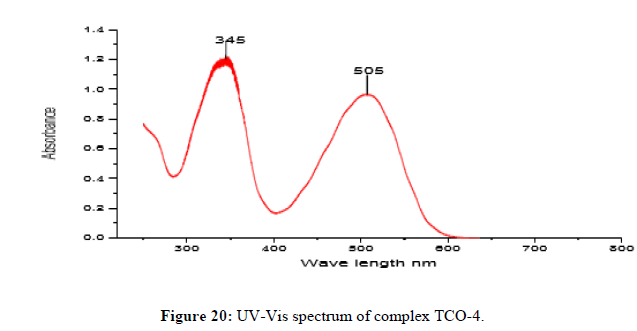
| 8 | TCO-4 | DMSO | 345 505 |
π → π* n → π* |
| 9 | TCO-5 | DMSO | 299 352 |
π → π* n → π* |
| 10 | TCO-6 | DMSO | 345 505 |
π → π* n → π* |
| 11 | TCO-7 | DMSO | 328 342 |
π → π* n → π* |
| 12 | TCO-8 | DMSO | 345 505 |
π → π* n → π* |
Table 3: UV-Vis most relevant absorptions.
| No. | Compound | υ(O-H)/H2O | υ(C-H) | υ(C=N) | υ(C=C) | υ(C-O) | New bands | |
|---|---|---|---|---|---|---|---|---|
| υ(M-N) | υ(M-O) | |||||||
| 1 | TL1 | 3313 | 2950 | 1462 | 1465 | - | - | - |
| 2 | TL2 | 3382 | 2923 | 1569 | 1461 | 1377 | - | - |
| 3 | TL3 | 3394 | 2854 | 1461 | 1535 | 1377 | - | - |
| 4 | TL4 | 3317 | 2917 | 1447 | - | 1371 | - | - |
| 5 | TCO-1 | 3425 | 2923 | 1593 | 1467 | 1684 | 584 | 495 |
| 6 | TCO-2 | 3240 | 2923 | 1617 | 1425 | 1761 | 586 | 492 |
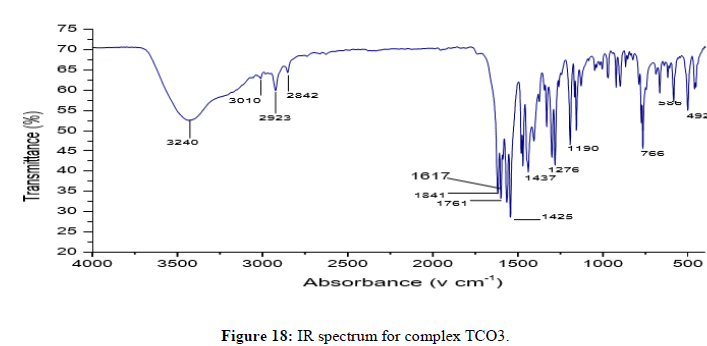
| 7 | TCO-3 | 3430 | 2923 | 1546 | 1473 | - | 506 | 506 |
| 8 | TCO-4 | 3420 | 2840 | 1532 | 1400 | - | 518 | 518 |
| 9 | TCO-5 | 3360 | 2922 | 1525 | 1458 | 1325 | 548 | 489 |
| 10 | TCO-6 | 3238 | 2924 | 1540 | 1450 | - | 580 | 489 |
| 11 | TCO-7 | 3385 | 2931 | 1525 | 1417 | - | 554 | 506 |
| 12 | TCO-8 | 3414 | 2924 | 1560 | 1437 | - | 517 | 456 |
Table 4: IR spectral data for most relevant absorptions.
Characterization of ligand (E)-2-benzylidene-1-phenylhydrazine (TL1) compound
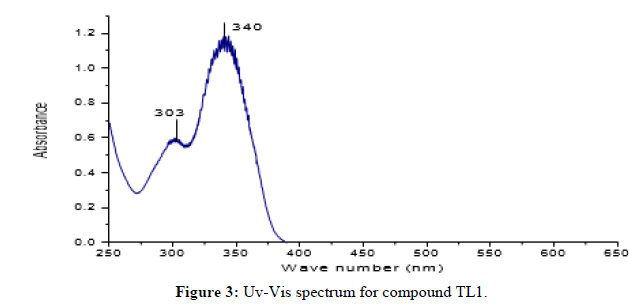
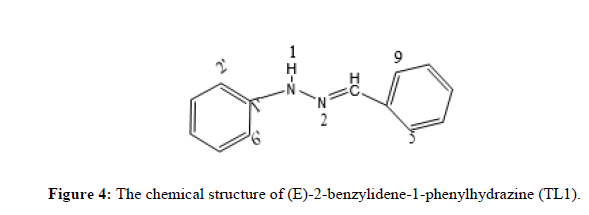
Compound TL1 is a brown solid with m.p 162°C and characterized by the following spectroscopic techniques to confirm that it is (E)-2-benzylidene-1-phenylhydrazine as expected from the synthesis carried out. UV-visible spectrum shown in figure-1 recorded in DMSO showed maximum absorption band at 303 nm and 340 nm attributed to π→π* transition of -C=C- and n→π* transition of the -C=N- groups respectively. The IR spectrum shown in Figure 2 (KBr, v in cm) shows weak intensity band at 3390 cm-1 showing the presence of N-H stretching of secondary amine. The strong band at 2950 cm-1 indicates the presence of C-H stretching of aromatic. A strong band at 2854 cm-1 confirmed the presence of C-H stretching methine. (E)-2-benzylidene-1-phenylhydrazine shows its characteristics absorption bands in the 1462 and 1257 cm-1 regions, assignable to C=N and N-N vibrations respectively. The 1HNMR spectrum (CDCl3, 400 MHz,) shows total of 7-protons, chemical shift value at δ 7.70-7.68 (1H, dd, H- 5 and 9), 7.60 (1H, S, H-3), 7.42 (1H, t, H-7), 7.35-7.31 (1H, dd, H-6 and 8), 7.29(1H, d, H-3‘ and 5‘), 7.16(1H, d, H-2‘and 6‘) and a triplet peak at 6.93 (1H, t, H-4‘). The 13C NMR spectrum (CDCl3): The Canbon-13 spectrum shows that the total of 9 carbons, 2 quaternary carbons, 7 methine. A signal at δ 144.66 and 132.31 ppm indicates the quaternary carbon (C-1‘and 4) respectively. Signals at δ 137.30, 129.3, 128.63, 128.45, 126.21, 120.13 and 112.77 show C-3, C-7, C-3‘and 5‘, C-5 and 9, C-6 and 8, C-4‘ and C-2‘ and 6‘ respectively. DEPT-135 spectrum of the NMR shows 7 methine signals at δ 137.30, 129.3, 128.63, 128.45, 126.21, 120.13 and 112.77 shows (C-3, C-7, C-3‘and 5‘, C-5 and 9, C-6 and 8, C-4‘ and C-2‘ and 6‘ respectively) (Figures 3 and 4).
Characterization of 2,2'-((1E,1‘E)-hydrazine-1,2- diylidenebis(methanylylidene))diphenol (TL2)
Ligand TL2 was obtained as yellow solid (melting point 187°C), in n-hexane:EthOAc (80:20). The UV-Visible spectrum recorded in DMSO showed band at 332 nm attributed to π→π* transition of the -C=N- group. The IR stretching (KBr, v in cm-1) spectrum shows medium intensity band at 3382 indicates the presence OH. The absorption bands at 2923 cm-1 shows the C-H stretching. Medium bands at 1569 cm-1 shows the presence of C=N. The medium peak at 937cm-1 shows the presence of N-N stretching. The 1HNMR spectrum (CDCl3, 400 MHz) shows a total of 6-protons at chemical shift value δ 11.45 (1H,S,OH),7.95 (1H, S, H-1), 7.44 (1H, d, H-7), 7.13 (1H, dd, H-5), 6.97(1H, t, H-6) and 7.07 shows (1H, d, H-4). The 13C NMR spectrum (CDCl3) shows that the total of 7 carbons (i.e., two quaternary carbons and 5 methine). A signal at δ 159.79 ppm indicated the presence of SP2 oxygenated quaternary carbon (C-4). A signal at 118.42 ppm indicates the quaternary carbon (C-3) respectively. A signal at δ 146.79, 133.47, 130.03, 119.77 and 116.53 shows (C-1, C-5, C-7, C-6 and C-4 respectively). DEPT-135 spectrum also shows 5 methine at δ 146.79, 133.47, 130.03, 119.77 and 116.53 assignable to C- 1, C-5, C-7, C-6 and C-4 respectively (Figures 5 and 6).
Characterization of (E)-2-(2-hydroxybenzylidene)-1-phenylhydrazine (TL3)
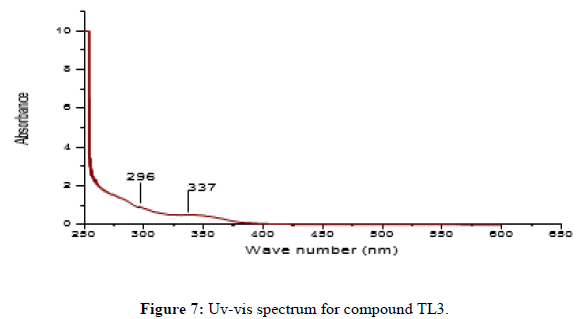
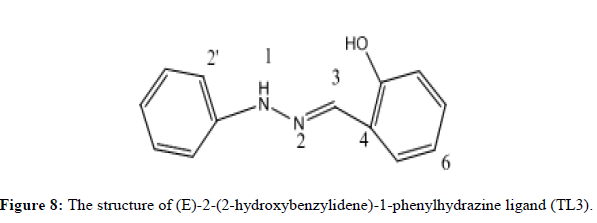
Ligand TL3 identified as (E)-2-(2-hydroxybenzylidene)-1-phenylhydrazine was obtained as yellowish solid (melting point 162°C) in n-hexane:EthOAc (80:20). The UV-Visible spectra of TL-3 was recorded in DMSO and shows maximum absorptions at 296 nm which is attributed to π→π* transition and around 337 nm for n→π* transition for v(-C=N-) and v(N-N-) groups respectively. The IR (KBr pellet, v in cm-1) spectrum shows a broad signal at 3394 indicates the presence OH. The absorption bands at 2854 cm-1 shows the presence of aromatic C-H stretching. Medium intensity bands at 1600 and 1535 cm-1 shows the aromatic C-C double bond. The medium peak at 1377 cm-1 shows the presence of C-O stretching. Bands observed at 3390, 1461 and 1218 cm-1 regions are assignable to N-H, C=N and N-N vibrations respectively. The 1HNMR spectrum (CDCl3, 400 MHz) shows total of 9-protons. Chemical shift values at δ 11.05 (1H,S, OH), 7.78 (1H, S, H-3), 7.35 (3H, m, phenyl ring), 7.16 (1H, dd, H-9), 7.06 (1H, d, H-6), 7.01(1H, dd, H-8) and 6.96 shows (1H, dd, H-7). The 13C NMR spectrum shows a total of 11 carbons. 3 quaternary carbon, 8 methine. A signal at δ 156.98 ppm indicated the presence of SP2 oxygenated quaternary carbon (C-5). A signal at 143.40 and 118.58 ppm indicates the quaternary carbon (C-1‘and C-4) respectively. A signal at δ 141.20, 130.05, 129.60, 129.44, 120.89, 119.58, 116.61 and 112.62 shows; (C-3, C-7, C-9, C-3‘and 5‘, C-8, C-4‘, C-2‘ and 6‘ and C-6 respectively). And DEPT-135 spectrum shows 8 methine. Signals at δ 141.20, 130.05, 129.60, 129.44, 120.89, 119.58, 116.61 and 112.62 indicate C-3, C-7, C-9, C-3‘ and 5‘, C-8, C-4‘, C-2‘ and 6‘ and C-6 respectively) (Figures 7 and 8).
Characterization of (E)-2-(4-nitrobenzylidene) phenylhydrazine (TL4)
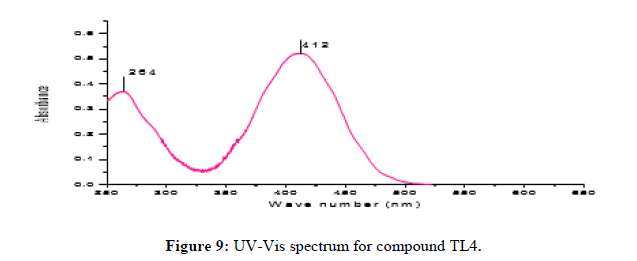
The (E)-2-(4-nitrobenzylidene)-1-phenylhydrazine was obtained as Red solid with melting point around 193°C. The UV-Visible spectrum for ligand TL4 was recorded in DMSO shows absorption bands at 264 nm attributed to π→π* transition of -C=C- group and around 412 nm due to n→π* transition of the -C=N- group. IR spectrum (KBr, v in cm-1) compound shows characteristic bands at 3317 cm-1 for the presence of N-H stretching at 2952 for aromatic Sp2 C-H and 2872 cm-1 for azomethine SP2C-H vibrations. Signals at 1447.5cm-1 and 811 cm-1 regions are assignable to C=N and N–N vibrations respectively. The 1HNMR spectrum (CDCl3, 400 MHz) shows total of 6-protons with chemical shift values of δ 8.15 (1H, d, H-6&8), 8.08 (1H, S, H-3), 7.80 (1H, dd, H-5 and 9), 7.35 (1H, dd, H-3‘ and 5‘), 7.15 (1H, t, H-4‘) and a triplet peak at 6.95 (1H, d, H-2‘ and H-6‘). The 13C NMR spectrum shows a total of 9 carbons (i.e., 3 quaternary carbon, 6 methine). A signal at δ 146.99, 143.58and 141.76 ppm indicates the quaternary carbon (C-7, C- 1‘ and C-4) respectively. A signal at δ 133.79, 129.48, 126.24, 124.13, 121.27 and 113.12 for C- 3, C-5 and 9, C-3‘ and 5‘, C-6 and 8, C-2‘, C-4‘ and C-6‘ respectively. DEPT-135 spectrum shows 6 methine at δ 133.79, 129.48, 126.24, 124.13, 121.27 and 113.12 for C-3, C-5 and 9, C-3‘and 5‘, C-6 and 8, C-4‘and C-2‘and 6‘ respectively (Figures 9 and 10).
Characterization of complex TCO-1
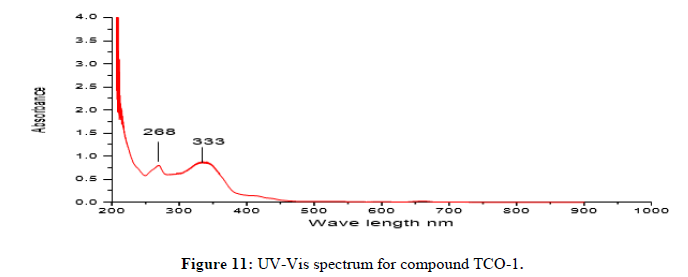
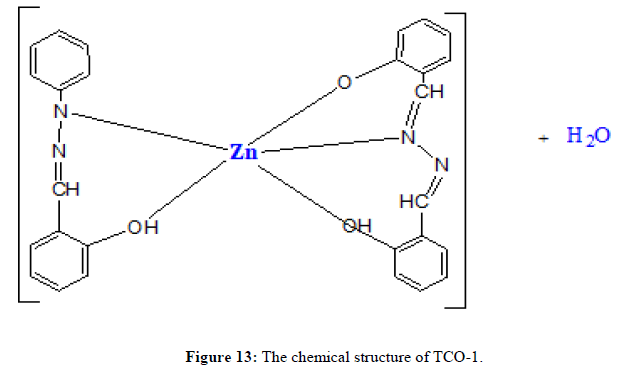
Complex TCO-1 is a white solid with a M.P. of 215°C. The Uv-visible spectrum for was recorded in DMSO and shows band at 268 nm attributed to -C=C- π→π* electronic transition around 333 nm due to n→π* transition of the v(-C=N-) azomethine chromophore. The IR spectrum (KBr, v in cm-1) shows a peak at 3425 cm-1 which could be attributed either for the O-H stretching of coordinated water or for the amine N-H stretching or for both. The strong band at 2923 cm-1 confirms the presence of aromatic C-H vibrations. A medium band at 1593 cm-1 confirms the presence of C=N stretching of azomethine. A medium band at 1467 cm-1 confirms the presence of aromatic C=C stretching. A band at 1684 cm-1 confirms the presence of aromatic C-O stretching’s. A signal at 584 cm-1 attributed to Zn-N and at 495 cm-1 to Zn-O stretchings. This fact suggests the coordination of ligand through the nitrogen Ph–NH of phenyl hydrazine (Figures 11-13) [14,15].
Characterization of TCO-2
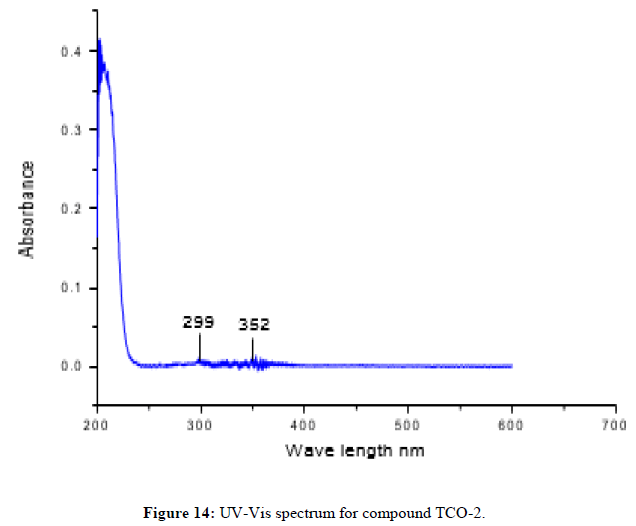
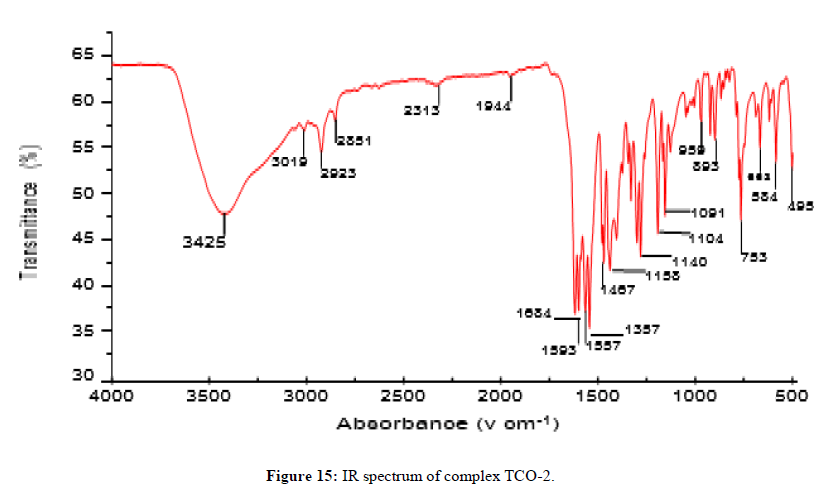
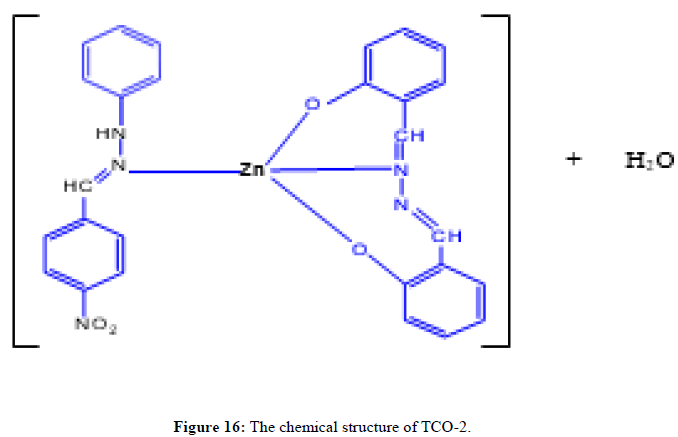
The complex TCO-2 was obtained by the reaction of (TL4+TL2+Zn) as a light yellow solid with M.P. 215°C. The UV-Visible spectra for compound TCO-2 were recorded in DMSO shows band at 299 nm -C=C-, π→π;*, the band around 352 nm n→π;* transition of the v(-C=N-) azomethine chromophore. The IR spectrum (KBr, v in cm-1) for compound TCO-2 shows characteristic medium band at 3240 cm-1 confirmed the presence of N-H or coordinated water O- H stretching. The strong band at 2923-2842cm-1 confirms the presence of C-H vibrations of aromatic. A medium band at 1617cm-1 confirms the presence of C=N stretching of azomethine. A medium narrow band at 1425 cm-1 confirmed the presence of aromatic C=C stretching. A band at 586 cm-1 attributed to Zn-N coordination and a band between 443 cm-1-492 cm-1 to Zn-O (Figures 14-16).
Characterization of TCO-3
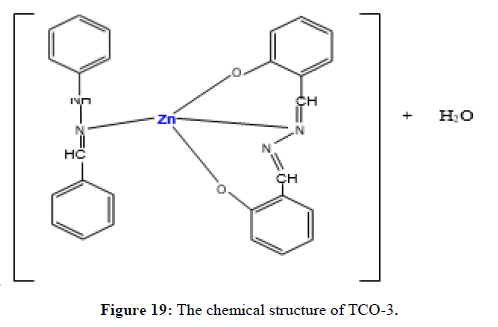
Complex TCO-3 was obtained by the reaction of (TL1+TL2+Zn) as a brown solid with melting point around 190°C. The Uv-visible spectrum was recorded in DMSO and shows maximum absorption at 289 nm for π;→π;* transitions of -C=C- group and 359 nm due to n→π;* transition of the v(-C=N-) group. The IR spectra (KBr pellet; v in cm-1) of complex TCO-3 exhibiting broad band signal in the range of 3430cm-1 could be attributed to the O-H vibrations of coordinated water molecules. A band at 2923 cm-1 indicates benzylic sp2 C-H vibration. A band at 2845 cm-1 indicates aromatic sp2C-H vibration. Absorption bands at 1473 cm-1 and 1546 cm-1 occur due to the presence of aromatic C=C and azomethine C=N vibrations respectively. The N-H stretching absorption of free ligand remained unaffected after complex formation. During complex formation, the carbonyl bands were shifted to lower frequency indicating the linkage of the metal with oxygen atom. In the lower frequency region, the weak bands observed at 584 cm-1 and 506 cm-1 are assigned to the Zn-N and Zn-O vibrations, respectively. This fact suggests the coordination of ligand through the nitrogen Ph-NH of phenyl hydrazine (Figures 17-19) [14,15].
Characterization of TCO-4
Complex TCO-4 was obtained by the reaction of (TL-3+TL-3+Zn) as yellow powder (melting point 190). The Uv-visible spectrum for compound TCO-4 was recorded in DMSO and shows band at 345 nm for π→π* transition of -C=C- group and 505 nm for n→π;* transition of the v(-C=N-) group. The IR (KBr pellet; v in cm-1) spectrum shows weak absorption band around 3420 cm-1 indicating the presence O-H vibrations of coordinated water molecules and 3104 cm-1 corresponds amine N-H vibrations. A band at 2922 cm-1 reveals aromatic sp2C-H vibrations, a band at 2840 cm-1 reveals benzylic sp2C-H vibrations. A band at 1624cm-1 in free Schiff base is due to C=N vibration. A strong band at 1101 cm-1 indicated C-N stretch that attached to aryl carbon. A band at 952 cm-1-830 cm-1 confirmed the presence of N-N stretching of azomethine. A band at 539 cm-1 indicates the formation of (Zn-N) and a band a476 cm-1 shows the formation of (Zn-O). The shifting of band to lower frequency in the metal complexes when compared to free ligand, suggests the coordination of metal ion through nitrogen atom of azomethine group. It is expected that coordination of nitrogen to the metal atom would reduce the electron density in the azomethine link and thus lower the -HC=N absorption (Figure 20-22) [16].
Characterization of TCO-5
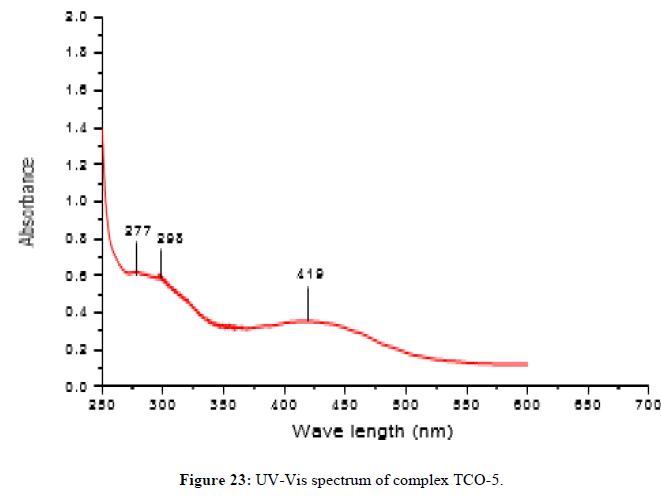
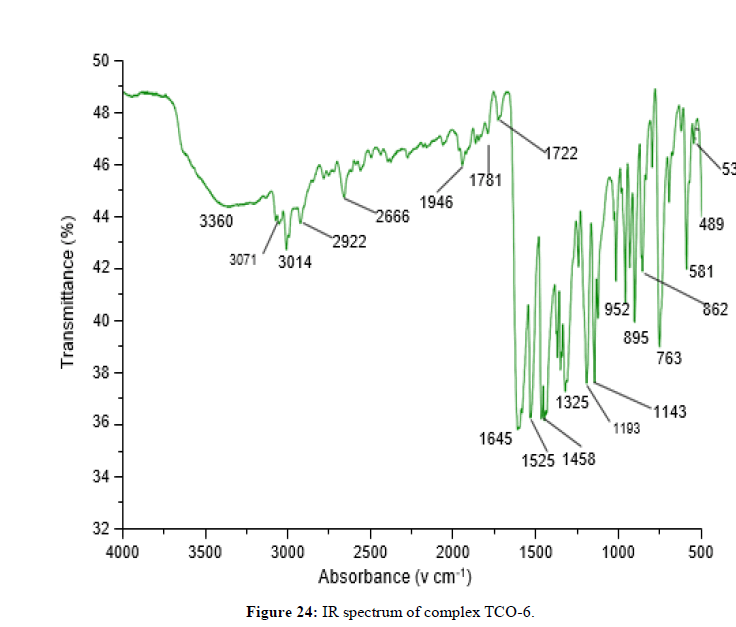
The complex TCO-5 was obtained by the reaction of (TL4+TL2+Cu) as green solid (melting point 245) in n-hexane-ethyl acetate (85:15). The Uv-Visible spectrum of TCO-5 was recorded in DMSO and shows band at 298 nm π;→π;* transition for -C=C- chromophore and around 419 nm due to n→π;* transition of the v(-C=N-) azomethine chromophore. The IR spectrum of the schiff base has a strong absorption band at 3014 cm-1 which corresponds to the N-H vibrations. A medium intensity band at 1525cm-1 is regarded as an aromatic -C=C- vibrations. The shift of band to lower wave number indicates that the azomethane nitrogen is coordinated to the metal ion. The high intensity band due to Phenolic C-O appeared at 1324 cm-1 in the Schiff base, appeared as a medium to high intensity band in the 1458 cm-1 region in the complex. New bands, which are not present in the spectrum of ligand appeared in the spectra of complexes in the range of 538 cm-1-581 cm-1, corresponding to ν(Cu-N) and 489 cm-1 to ν(Cu-O) vibrations respectively [17]. The appearance of ν(Cu-N) and ν(Cu-O) vibrations support the involvement of N and O atoms in complex formation with metal ions (Figures 23-25).
Characterization of TCO-6
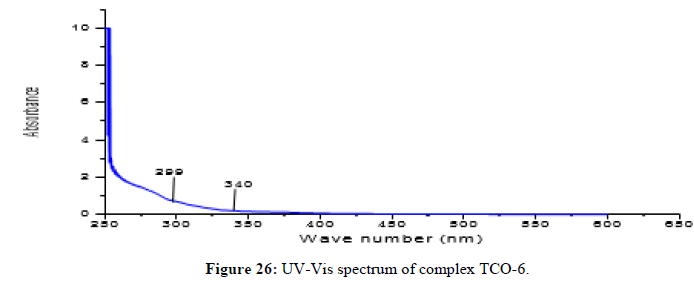
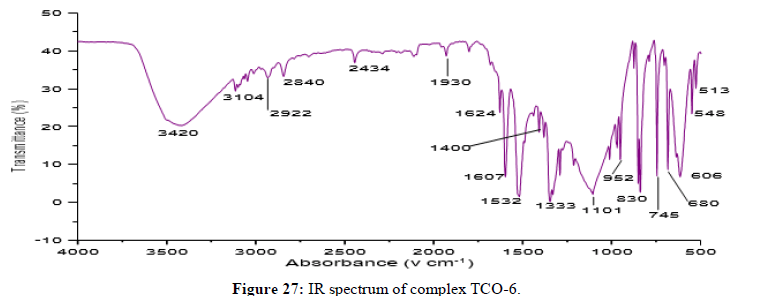
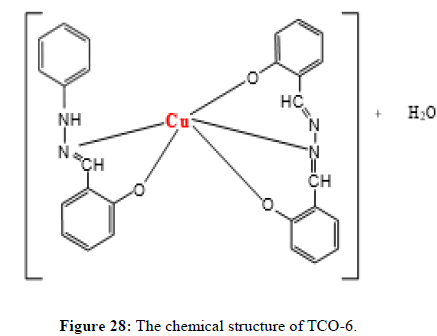
Complex TCO-6 was obtained by the reaction of (TL3+TL2+Cu) was obtained as greenish dark (melting point 217) in n-hexane-ethyl acetate (80:20). The UV-visible spectrum for compound TCO-6 were recorded in DMSO shows band at 340 nm π;→π;* transition from -C=C- chromophore and n→π;* transition of the v(-C=N-). The IR (KBr pellet; v in cm-1) spectrum a weak absorption band at 3054 cm-1 corresponds (N-H, amine). A band at 2924 cm-1 revealed aromatic sp2C-H stretch, Absorption band in the range 2675 indicate aliphatic C-H stretching. Absorption band at 145° cm-1 due to aromatic C-C double bond stretching. A strong band at 1144 cm-1 indicated C-N stretch that attached to aryl carbon. New bands, which are not present in the spectrum of ligand, appeared in the spectra of complexes in the range of 580 cm-1, corresponding to ν(Cu-N) and 489 cm-1 to ν(Cu-O) vibrations respectively. The appearance of ν(Cu-N) and ν(Cu-O) vibrations support the involvement of N and O atoms in complexation with the cupper II ion (Figures 26-28).
Characterization of TCO-7
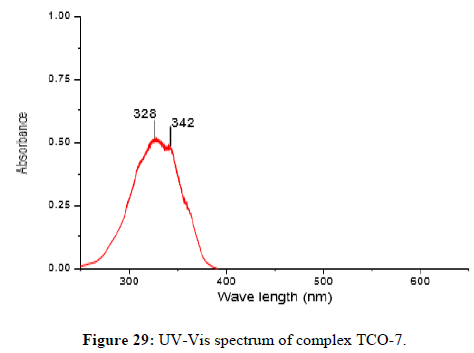
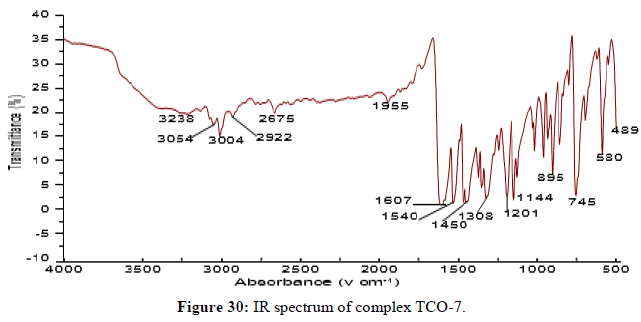
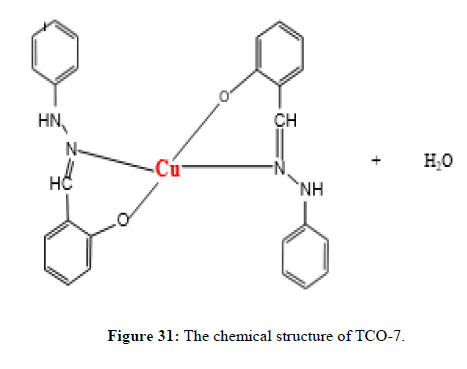
The Complex TCO-7 was obtained by the reaction of (TL-3+TL-3 Cu), TCO-7 compound were obtained as greenish dark (melting point 231) in n-hexane–ethyl acetate (85:15) the data were obtained. The Uv-visible spectrum of TCO-7 was recorded in DMSO shows band at 328 nm and 342 nm π;→π;* transition from -C=C- chromophore and n→π;* transition of v (-C=N-) chromophore. The IR (KBr pellet;v in cm-1) spectrum a weak absorption band at 3385 cm-1corresponds (N-H, amine). A band at 2931 cm-1 revealed aromatic sp2 C-H stretch. A band at 2822 cm-1 revealed aromatic sp2 C-H stretch. Absorption band at 1417 cm-1 due to aromatic C-C double bond stretching. A strong band at 1525 cm-1 indicated C-N stretch that attached to aryl carbon. Bands, which are not present in the spectrum of ligand appeared in the spectra of complexes in the range of 588 cm-1-1554 cm-1, corresponding to ν(Cu-N) and 506 cm-1 to ν(Cu-O) vibrations respectively. The appearance of ν(Cu-N) and ν(Cu-O) vibrations support the involvement of N and O atoms in complex formation with metal ions (Figures 29-31).
Characterization of TCO-8
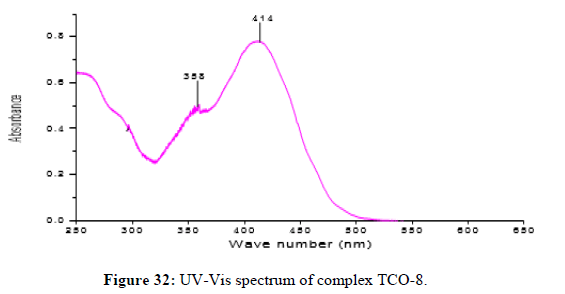
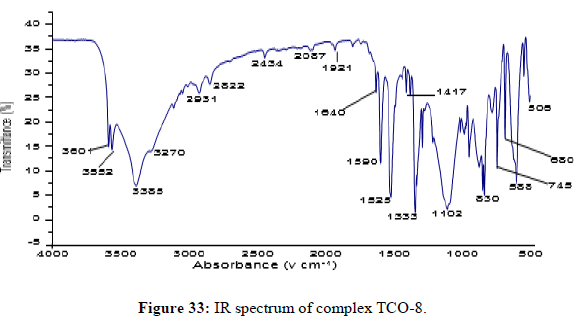
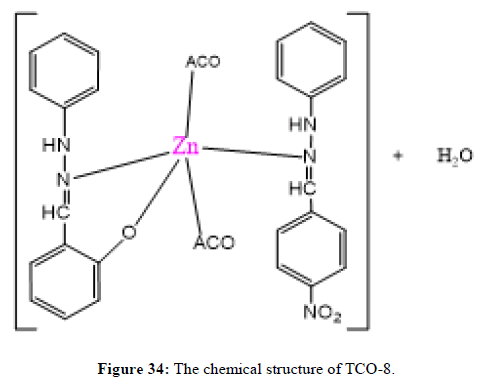
The complex TCO-8 was obtained by the reaction of (TL3+TL4 Cu) as greenish dark (melting point 205) in n-hexane–ethyl acetate (70:30). The Uv-visible spectrum for compound TCO-8 was recorded in DMSO shows band at 358 nm and 414 nm π;→π;* and n→ π;* transition of the -C=C- and v (-C=N-). The IR spectrum (KBr pellet; v in cm-1 exhibit broad bands peak in the range of 3414cm-1 indicating the presence of coordinated water molecules and 3187cm-1 (N-H, amine). A band at 2924 cm-1 revealed aromatic sp2C-H stretch. A band at 2841 cm-1 revealed aromatic sp2C-H stretch. A strong band at 1277 cm-1 indicated N-N stretch that attached to aryl carbon. A strong band at 1560 cm-1 indicated C-N stretch that attached to aryl carbon. A new band, which are not present in the spectrum of ligand appeared in the spectra of complexes in the range of 517 cm-1, corresponding to ν(Zn-N) and 456 cm-1 to ν(Zn-O) vibrations respectively. The appearance of ν(Zn-N) and ν(Zn-O) vibrations support the involvement of N and O atoms in complexation with zinc ions (Figures 32-34).
Antibacterial activity tests
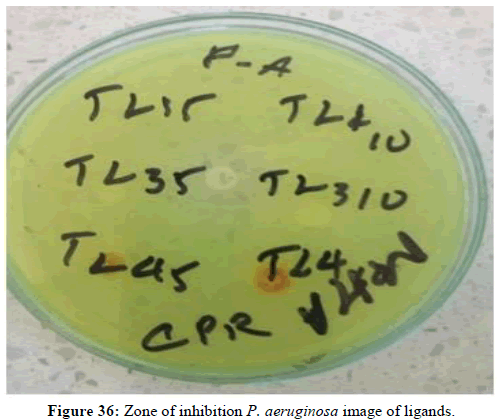
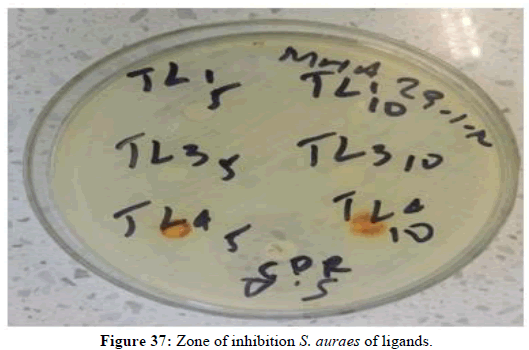
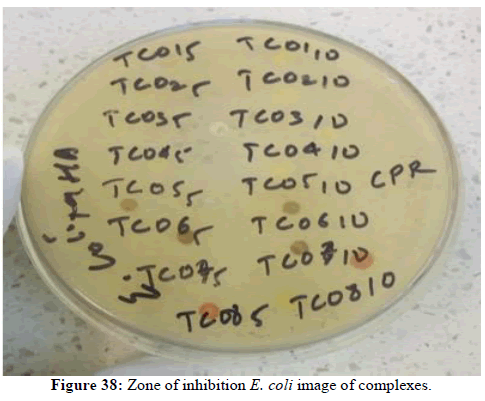
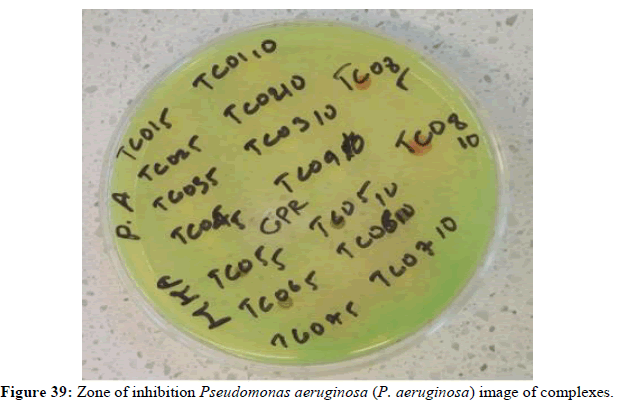
The in vitro anti-bacterial activity comparative study of the growth inhibition zone values of Schiff bases and their complexes against the gram +ve Staphylococcus auraes andgram –ve Escherichia coli and Pseudomonas aeruginosa using disc diffusion method indicates [18] that metal complexes exhibit higher anti-bacterial activity than the free ligand and the results is given in the Table 6. According to Overtone ‘s concept of cell permeability, the lipid membrane that surrounds the cell favors the passage of only lipid soluble materials due to which lip solubility is considered to be an important factor that controls the anti-microbial activity. On chelation, the polarity of the metal ion will be reduced to a greater extent due to the overlap of the ligand orbital and partial sharing of positive charge of metal ion with donor groups [19]. Further, it increases the delocalization of the π electrons over the whole chelate ring and enhances the lipophilicity of the complex. This increased lipophilicity enhances the penetration of the complexes into lipid membrane and thus blocks the metal binding sites on enzymes of microorganisms [20]. These metal complexes also disturb the respiration process of the cell and thus block the synthesis of proteins, which restricts further growth of the organism [21]. The variation in the activity of different complexes against different organisms depend either on the impermeability of the cells of the microbes or difference in ribosomes of microbial cells [22]. The inhibition zones of antibacterial activity are presented in the Tables 5 and 6. The zones of inhibition values (Figures 19-23) indicate that all the compounds exhibited a varied range 6 mm-21 mm of antibacterial activity (Tables 5 and 6). Ligand TL4 and metal complexes TCO-6, TCO-7 and TCO-8 showed comparatively good activities against Staphylococcus auras and the ligand TL1 have shown moderate antibacterial activity against Staphylococcus auras species. The complex TCO-7 and TCO-8 have showed comparatively good antibacterial activity against Escherichia coli than against other species. The complex TCO-5 and TCO-7 has shown better activity against Pseudomonas aeruginosa species.
| Agents/chemical (µl) | Inhibition zone(mm) on bacteria | ||
|---|---|---|---|
| S. auraes (mm) | E. coli (mm) | P. aeruginosa | |
| TCO-1(5) | 6 | 6 | 6 |
| TCO-1(10) | 6 | 6 | 6 |
| TCO-2(5) | 6 | 6 | 6 |
| TCO-2(10) | 6 | 6 | 9 |
| TCO-3(5) | 6 | 6 | 6 |
| TCO-3(10) | 6 | 8 | 6 |
| TCO-4(5) | 6 | 6 | 6 |
| TCO-4(10) | 6 | 6 | 6 |
| TCO-5(5) | 6 | 6 | 6 |
| TCO-5(10) | 6 | 7 | 6 |
| TCO-6(5) | 8 | 9 | 8 |
| TCO-6(10 | 13 | 8 | 11 |
| TCO-7(5) | 16 | 15 | 9 |
| TCO-7(10) | 17 | 20 | 14 |
| TCO-8(5) | 18 | 12 | 8 |
| TCO-8(10) | 21 | 16 | 11 |
| Ciprofloxacin | 25 | 28 | 23 |
Table 5. Antibacterial activity test results of metal complexes.
| Agents/chemical (µl) | Inhibition zone(mm) on bacteria | ||
|---|---|---|---|
| S. auraes (mm) | E. coli (mm) | P. aeruginosa (mm) | |
| TL1(5) | 6 | 6 | 6 |
| TL1(10) | 7 | 6 | 7 |
| TL3(5) | 6 | 6 | 6 |
| TL3(10) | 6 | 8 | 6 |
| TL4(5) | 6 | 6 | 6 |
| TL4(10) | 7 | 8 | 6 |
| Ciprofloxacin | 22 | 25 | 23 |
Table 6: Antibacterial activity of ligands.
The results of the antibacterial activity show that the copper (II) complexes of ligand having electron withdrawing substituent have showed excellent antibacterial activities [23]. In general, the results indicate that Cu (II) complexes gave highest activity or effective against the bacteria than the Zn (II) metal complexes and free ligand. However, as compared to the standard drugs antibacterial activities of the complexes are moderate TCO-5, TCO-6, TCO-7 and TCO-8 showed good antibacterial activities relative to the standard ciprofloxacin. As concentration of the complexes increase their activities increase correspondingly (Figures 35-39).
Conclusion
Four phenyl hydrazine based Schiff base ligands and their Cu (II) and Zn (II) complexes with varied combinations of the four ligands have been synthesized and characterized by different spectroscopic and analytical techniques. The spectroscopic techniques employed revealed that Schiff base coordinates through its azo-methane nitrogen ‘s to the metal ion and acts as a neutral bi-dentate ligand. All the complexes are stable and have sharp melting points that ranges from 162°C to 245°C indicating their high purity. The melting point is a vital physical property of a compound that can be used to identify a substance and as an indicator of its purity. The conductance measurements of all the synthesized ligands and complexes are non-electrolyte in nature. All of the synthesized compounds were evaluated in vitro for antibacterial activity by the disc diffusion method. The in-vitro antibacterial activities were screened against three different bacterial strains Staphylococcus auras, Escherichia coli and Pseudomonas aeruginosa. Of the four ligands, ligand TL4 showed the highest activity against all of the three bacterial strains. Complex TCO-8 showed the highest activity against S. auras but none of the ligands and complexes showed a higher activity than the standard ciprofloxacin.
References
- Raczuk E, Dmochowska B, Samaszko-Fiertek J, et al. Molecules. 2022; 27(3): p. 787.
[Crossref] [Google Scholar] [PubMed]
- M. Achparaki, E. Thessalonikeos, H, Tsoukali, O, et al. Schiff Bases and Their Metal Complexes: Synthesis, Structural Characteristics and Applications. Intech. 2012; 1: pp. 13.
- Omidi S, Kakanejadifard A. RSC Adv. 2020; 10(50): p. 30186-30202.
[Crossref] [Google Scholar] [PubMed]
- Kajal A, Bala S, Kamboj S, et al. J Catal. 2013;13(1):893-912.
- Mandal U, Mandal S, Chakraborty B, et al. Polyhedron. 2020; 177: p. 114-120.
- Hossain MS, Roy PK, Ali R, et al. Clin Med Res. 2017; 6(6): p. 177-191.
- Rakhtshah J. Coord Chem Rev. 2022; 467: p. 214-314.
- Crans DC, Kostenkova K. Commun Chem. 2020; 3(1): p. 104.
[Crossref] [Google Scholar] [PubMed]
- Van Cleave C, Crans DC. Inorganics. 2019; 7(9). P. 65-69.
- Osredkar J, Sustar N. J Clinic Toxicol. 2011; 3(2161): p. 495.
- Balouiri M, Sadiki M, Ibnsouda SK. J Pharm Anal. 2016; 6(2): p. 71-79.
[Crossref] [Google Scholar] [PubMed]
- Geary WJ. Commun Chem. 1971; 7(1): p. 81-122.
- Priyarega S, Tamizh MM, Karvembu R, et al. J Chem Sci. 2011; 123: p. 319-325.
- Nakamoto K. Theory of Normal Vibrations. Infrared and Raman Spectra of Inorganic and Coordination Compounds. John Wiley & Sons, Inc. 2008; pp. 1–147.
- Nakamoto K. Infrared and Raman Spectra of Inorganic and Coordination Compounds: Theory and applications in inorganic chemistry. John Wiley & Sons; 2008.
- Mounika K, Pragathi A, Gyanakumari C. J Sci Res. 2010; 2(3): p. 513.
- Raman N, Kulandaisamy A, Shunmugasundaram A, et al. Transit Met Chem. 2001; 26: p. 131-135.
- Salam MA, Al-Amin MY, Pawar JS, et al. Saudi J Biol Sci. 2023; 30(3): p. 103-182.
[Crossref] [Google Scholar] [PubMed]
- Rajavel R, Vadivu MS, Anitha C. J Chem. 2008; 5(3): p. 620-626.
- Nair R, Shah A, Baluja S, Chanda S. J Serb Chem Soc. 2006; 71(7): p. 733-744.
- Vaghasiya YK, Nair R, Soni M, et al. J Serb Chem Soc. 2004; 69(12): p. 991-998.
- Reddy NS, Shankara BS, Krishana PM, et al. Int J Inorg Chem. 2013; 2013(1): p. 614-628.
- Arthi P, Dharmasivam M, Kaya B, et al. Chem Biol Interact. 2023; 373: p. 110-349.
[Crossref] [Google Scholar] [PubMed]

