Research Article - Der Pharma Chemica ( 2018) Volume 10, Issue 7
Synthesis, Characterization and Applications of New Hydrotalcite-Like Nano and Innovative Materials
Radji G, Bahmani A*, Ezziane K, Bettahar N and Sellami M
Faculty of Chemistry, Laboratory of Chemistry of Inorganic Materials and Applications (LCMIA), University of Science and Technology of Oran - Mohamed Boudiaf - USTO-MB, BP. 1505 Oran, Algeria
- *Corresponding Author:
- Bahmani A
Faculty of Chemistry
Laboratory of Chemistry of Inorganic Materials and Applications (LCMIA)
University of Science and Technology of Oran - Mohamed Boudiaf - USTO-MB, BP. 1505 Oran, Algeria
Abstract
Hydrotalcite-like (layered double hydroxides, LDHs) belong to the class of inorganic lamellar compounds, and have a great capacity for insertion of anions. The basic structure of LDHs compounds are similar to a natural hydrotalcite Mg6Al2(OH)16. CO3. 4H2O, in this structure magnesium (divalent cation) was substituted with aluminum (trivalent cation) with a general formula:  . In recent years, the LDHs compounds have received considerable attention; anion exchange properties have been extensively studied. The interst LDHs magnetic and electrochemical properties permit heterogeneous catalysis and applications in the treatment of polluted water. The LDH compounds were used as adsorbents or catalysts in reaction of degradation to non-biodegradable products. In this work, carbonated sample LDHs of type NiAl-CO3, NiCuAl-CO3 and CuAl-CO3 were synthesized and calcined at various temperatures. The products were used as catalysts in the phenol degradation with hydrogen peroxide. The carbonated samples are obtained by coprecipitation at constant pH with a molar report R (R=MII/MIII) equal to 2.0. The calcination leads to the nanometric size oxide compounds. The as-prepared LDHs-compounds “carbonated” and calcined are characterized by XRD, DTA/TG and FTIR. The calcination occurs at several temperatures and some parameters were tested as catalyst mass, oxidant H2O2 volume, temperature and time of contact.
Keywords
Hydrotalcite, Phenol, Catalytic oxidation, Free radicals.
Introduction
Layered double hydroxides compounds represent an interesting class of materials due to their various applications. For example, hydrotalcites formed by transition metal ions are potentially interesting because the redox chemistry can be combined with the structural forms of these materials. The structure can be illustrated like brucite compound with formula [Mg(OH)2] where an isomorphous substitution of Mg2+ by Al3+ occurs, and the resulting excessive positive load is compensated by anions occupying inter-layers spacing as well as water molecules. Layered Double Hydroxides LDHs or anionic clay [1] is a rare material in nature but easy and simple to prepare at the laboratory.
Since the end of the sixties, the LDHs are the object of an interest growing for their properties of anion exchange [2], their capacities of adsorption [3,4], their use in catalysis [5] and their pharmaceutical applications [6]. It is consist of metal hydroxides layers with anions in inter-layer space in Figure 1. The LDHs are very similar to that of natural hydrotalcite Mg6Al2(OH)16(CO3).4H2O [1], where some of Mg2+ represented as [MII] are isomorphously replaced by Al3+ represented as [MIII] and the net positive charge is compensated by the inter-layered exchangeable anion (An−). The general formula of these compounds can be represented as: 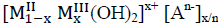 . mH2O, with MII and MIII as metal cations and An− as exchangeable anions. The structure consists of a stacking of layers of the brucite type (M2+, M3+)(OH)2. Many divalent and trivalent metals can be combined to form the layers of the LDHs. The layers most usually synthesized have aluminum and magnesium base, as in natural hydrotalcite.
- Divalent metals: Zn2+, Ni2+, Cu2+, Co2+, Fe2+, Ca2+,...etc.
- Trivalent metals: Cr3+, Fe3+, Co3+, Mn3+, V3+,...etc.
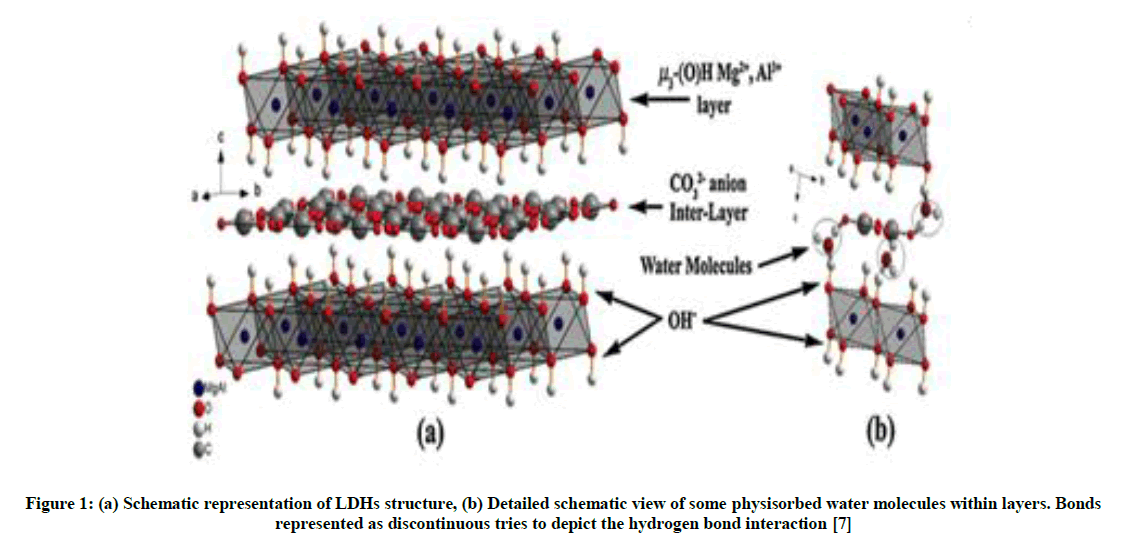
Figure 1: (a) Schematic representation of LDHs structure, (b) Detailed schematic view of some physisorbed water molecules within layers. Bonds represented as discontinuous tries to depict the hydrogen bond interaction [7]
Experimental Methods
Synthesis of NiAl-CO3, NiCuAl-CO3 and CuAl-CO3 catalysts
Hydrotalcite-like catalysts were synthesized by the low technique of supersaturation [8-10]. Two solutions (solution (A) containing the desired quantity of metal chlorides of Cu, Ni, Al and solution (B) containing the precipitant agents NaOH and Na2CO3) were added simultaneously. The pH was maintained around 9 to 10 and the solution was stirred vigorously at the room temperature. At the end, the final pH of solution was adjusted at 9.8 ± 0.2; the mixture was continuously stirred and kept at 70°C for 18 h, then was cooled at room temperature and filtered. The obtained solid was washed using distilled water and then dried at 80°C for 20 h. In all the cases, the molar report R between the bivalent and trivalent cations was maintained around 2.0. The calcination process of the samples was performed with a heating rate of 2°C/min in air and the final calcination temperature was maintained for 6 h.
Techniques
Powder X-ray diffraction (XRD) patterns of the catalysts were recorded using an instrument of Siemens D-5000, using Cu-Kα radiation (λ=0.15405 nm) and equipped with software of identification of the crystalline phases by comparison with JCPDS files. The infrared (FTIR) spectra were obtained in 4000-400 cm-1 range with 10 cm-1 resolution on a Perkin-Elmer FT1730 spectrometer using the KBr pellet technique. Thermogravimetric (TG) and Thermodifferentiel (TD) analysis were carried out with a Perkin Elmer TG-7 and DT-7. The assay was performed in a static atmosphere of air, using a heating rate of 5°C min-1 from the ambient temperature to 500°C.
Measurements of the catalytic activity
The catalytic oxidation process of phenol was carried out with a 50 ml in glass flask fitted with a reflux condenser. The hydrogen peroxide (30% w/v) was added to the solution of phenol containing catalyst under magnetic stirrer. The solution is maintained at the desired temperature of reaction. The phenol concentration in the solutions was determined using high-performance liquid chromatography (HPLC); this technique was performed using an Agilent 1220 Series LC equipped with Zorbax Eclipse C-18 column (4.6 mm x 250 mm x 5 μm) and a UV detector operating at 270 nm. The operating parameters were as follows: injection port temperature (25°C), injection volume (20 μl), mobile phase (a mixture of 50% methanol (HPLC quality) and 50% of bidistilled water) and constant flow rate (0.5 ml. min-1).
Several calcinations of the catalysts and several parameters as the mass of catalyst, the ratio oxidant/substrate, the temperature and the time of contact were tested.
Results and Discussion
Characterization of NiAl-CO3, NiCuAl-CO3 and CuAl-CO3 catalysts
Powder XRD patterns of the catalysts are similar to those typically reported in the literature for hydrotalcite materials intercalated with carbonate anions [11], assuming an assembly 3R of layers. The exhibited characteristic peaks of diffraction close to 2θ=11°, 23° and 35° (dhkl=7.6, 3.76 and 2.55 Å, respectively), are ascribed to diffraction by basal planes (003), (006) and (009), respectively (Figure 2).
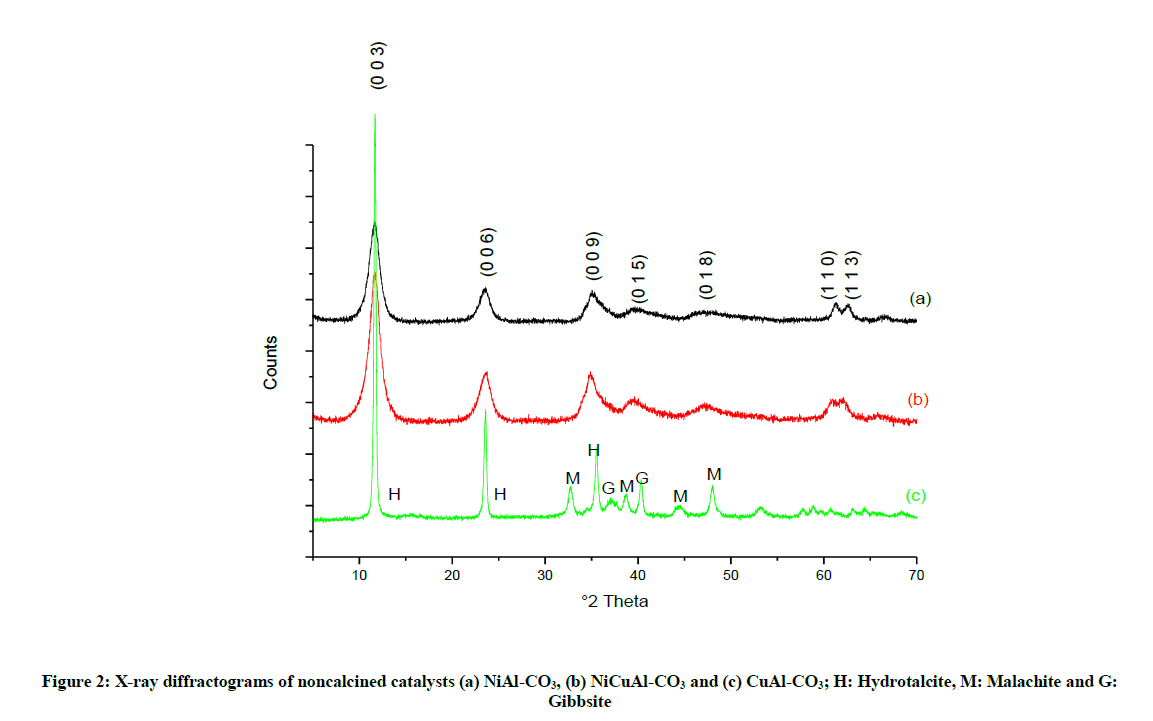
Figure 2: X-ray diffractograms of noncalcined catalysts (a) NiAl-CO3, (b) NiCuAl-CO3 and (c) CuAl-CO3; H: Hydrotalcite, M: Malachite and G: Gibbsite
The plane (003) is characteristic of the successive stacking of layers along c-axis. The lattice parameter c is equal to the calculated thickness of the sum of a layer of brucite (4.8 Å) and the inter-lamellar space (almost 2.82 Å for carbonates anions), that is ie the value of the interplanar distance of the planes (003). The cell parameter c is calculated using the position of the first basal peak (003) according to c=3d (003), the computed values are included in Table 1.
| Catalysts | c (Å) | a |
|---|---|---|
| NiAl-CO3 | 22.88 | 3.022 |
| NiCuAl-CO3 | 22.72 | 3.04 |
| CuAl-CO3 | 22.69 | 3.047 |
Table 1: Cell parameters
The first peak of the doublet of almost 2θ=60° is due to the diffraction of the plans (110), this plan is independent of the type of stacking of the layers and is used to calculate the cell parameter a [1]. The parameter a corresponds to the distance between the cations close within a layer of the brucite type and is defined starting from the reticular distance d(110) (a=2 x d(110)). A change of cation involves an evolution of the parameter a (Å). The values of the parameters for the samples are represented in Table 1.
The cell parameter c can be also related to the Colombian forces between the layers and the intercalated anion; in this case, in all the catalysts no variation of the parameter c is foreseeable. The median value of d(003) is 7.58 Å. We can note that the size of the doublet of almost 2θ=60° is in increase while passing from the sample NiAl-CO3 to CuAl-CO3, and these two peaks are rather broad for the sample NiAl-CO3. This result is very surprising, Ni2+ (7.2 Å) having a higher ionic ray than Cu2+ (6.9 Å). This phenomena can be explained partly by the Jahn-Teller effect according to which the Cu2+ ions lead to the formation of octahedral of groupings deformed hydroxyls, involving consequently an increase in parameter a.
It is well known that the complexes of octahedral coordination of Cu2+ (configuration d9) show a strong Jahn-Teller effect. It is most remarkable that for the case containing less copper, the deformation presents in the layers of the brucite (because of the presence of copper) is assumed by the mesh; however, when the copper contents are rather large, the deformations cannot be adopted by the structure. However for the sample CuAl-CO3, one observes the appearance of new lines located towards 2θ=32°, 38°, 44° and 48° (corresponding respectively to dhkl=2.73; 2.32; 2.04 and 1.89 Ǻ) which are characteristic of malachite phases type Cu2(OH)2(CO3), and other lines located towards 2θ=37° and 40° (corresponding respectively to dhkl=2.42 and 2.23 Å) which are characteristic of gibbsite phases. A mixture of phases thus exists for this compound of which the degree of purity is consequently weakened; these results were also found by S. Britto [12].
According to the results of the analysis by X-ray diffraction, the diffractogram of NiCuAl-CO3 (molar ratio R=2) present a better crystallization with the characteristic peak (003) most intense, thus translating crystallites of sizes more important as well as a better rearrangement of the layers. All the bands from FTIR spectra (Figure 3) are similar to those exhibited by hydrotalcite-like phase with CO32- as interlamellar anion [13]. Thus, the active absorption band around 3331-3400 cm-1 is assigned to the vibrations of valence (stretching) of the groupings OH existing in the brucite layer and the water molecules in inter-lamellate space related to carbonates by hydrogen bonds, the unfolding of νOH band is due to the appearance by causing a structure disordered.
Figure 3: FTIR spectra of noncalcined catalysts NiAl-CO3, NiCuAl-CO3 and CuAl-CO3
A peak approximately at 1636 cm-1 is corresponding to the vibration of deformation of the water molecules intercalated in inter-lamellate space. The absorption band characterizing anion CO32- is located at 1369-1390 cm-1. The bands in the low frequency area (800-400 cm-1) are assigned the vibrations of metallic oxides MO and O-M-O (M = Cu or Al or Ni).
The thermogram TG presents several losses of mass differentiated well like usually listed in the literature [1,14-15]. According to this thermogram (Figure 4) of NiCuAl-CO3 phase, we can notice two stages of loss: the first begin at room temperature until 170°C, correspond to the loss of physically absorbed water on the surface of material and the water located in the inter-lamellar field too. The loss can be expressed by the following equation:

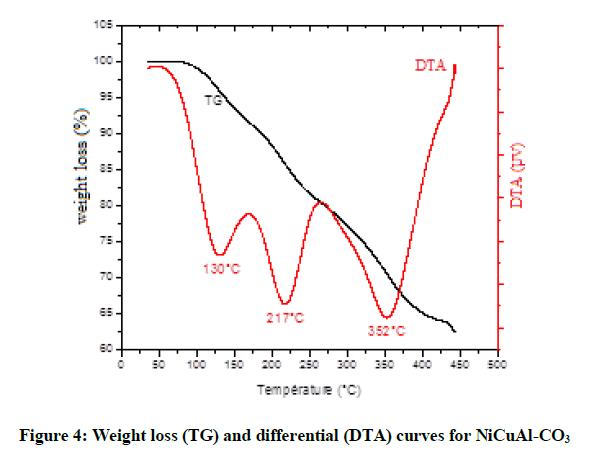
Figure 4: Weight loss (TG) and differential (DTA) curves for NiCuAl-CO3
The second loss of mass is recorded between 170 and 500°C and can be associated with the decomposition of the hydroxyls groups (water formation) and the anions carbonates of compensation (CO2 formation). A decomposition of the lamellar structures and formations of mixed oxides is confirmed later by XRD. These phenomena can be expressed by the following equation:

The DTA curve indicates two temperatures of maximum loss of the ions carbonates (around 217°C and 352°C). These well-differentiated losses of mass could indicate the existence of two types of ions carbonates, one localized about the middle of the inter-lamellar field and broken up towards 217°C, the other near to the layers of the brucite type forming hydrogen bonds with the groupings hydroxides which would require consequently a little energy more consequent to break [16].
The position of the first endothermic peak coincides with the first loss of mass (approximately 20%) between 20-170°C for the sample NiCuAl- CO3 The second and third peaks DTA are assigned to the mass loss between 170°C and 500°C and which accounts for 16-18%. The phases NiCuAl-T°C were obtained by calcination of the carbonated phase in an oven with programming of temperature with rise in temperature of 2°C/min, starting from the room temperature until the calcination temperature (in our work, 500 and 900°C), the final calcination temperature is maintained for 6 h. The calcination makes it possible to increase specific surface and porous volume thanks to the departure of the water molecules and the transformation of anions CO3 2- into CO2.
Characterization of the catalysts NiCuAl-500 and NiCuAl-900
Powder XRD patterns of NiCuAl-500 and NiCuAl-900 catalysts (Figure 5) shows the appearance of several peaks not similar to hydrotalcite, which translates the destruction of the lamellar structure. This behavior is explained by the departure of interfoliaceous water H2O and the anions carbonates CO32- at the time of the heat treatment. The broad lines observed in the case of TCalcination=500°C is characteristic of slightly made up are crystallized. The recorded positions 2θ=37°, 43° and 63° correspond to the principal characteristic peaks of diffraction of oxide NiO and CuO of which the positions are 2θ=35°, 38 and 48°. We observed that the increase in the calcination temperature makes the peaks more pointed and more intense what means the increase in the crystallinity of oxides with the appearance of other phases type spinel NiAl2O4 and CuAl2O4.
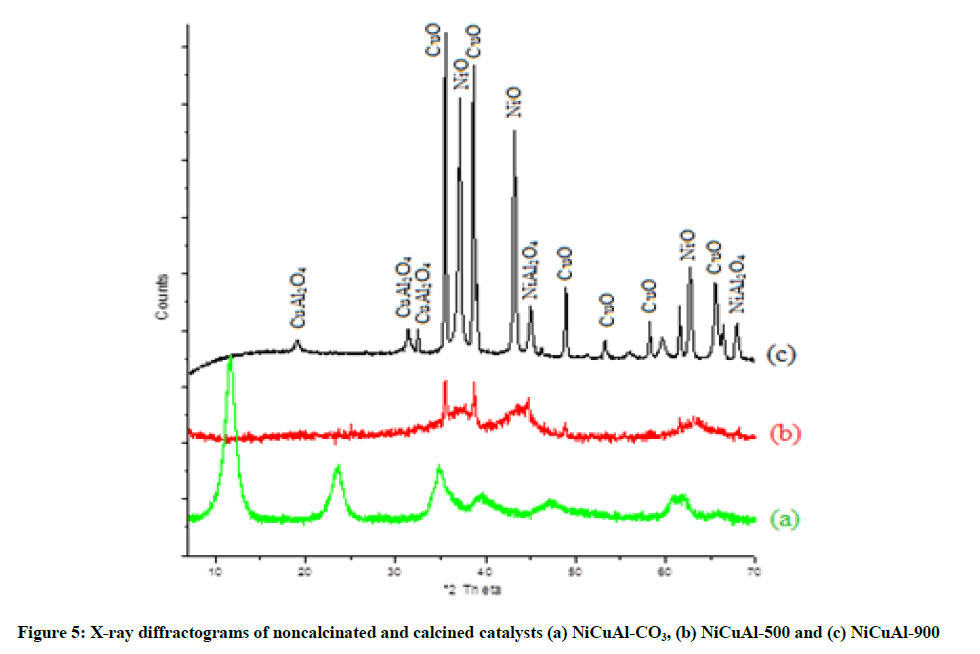
Figure 5: X-ray diffractograms of noncalcinated and calcined catalysts (a) NiCuAl-CO3, (b) NiCuAl-500 and (c) NiCuAl-900
The infra-red spectra of calcined materials (Figure 6) show the relative reduction of the intensity of the absorption characteristic bands of the water molecules (to approximately 3442 cm-1 for NiCuAl-500 and 3456 cm-1 for NiCuAl-900), and in the range 400 cm-1 to 700 cm-1 an increase of the intensity of the absorption bands is observed. These bands are corresponding to the characteristic vibrations of the MO bonds. We can note that the band located around 1360 cm-1 for the two materials is still detectable. Nevertheless, the low intensity of this band, compared with that observed for starting materials, suggests that ions carbonates are adsorbed on the surface of the grains of calcined materials, the presence of those ions would be due to a contamination by atmospheric carbon dioxide.
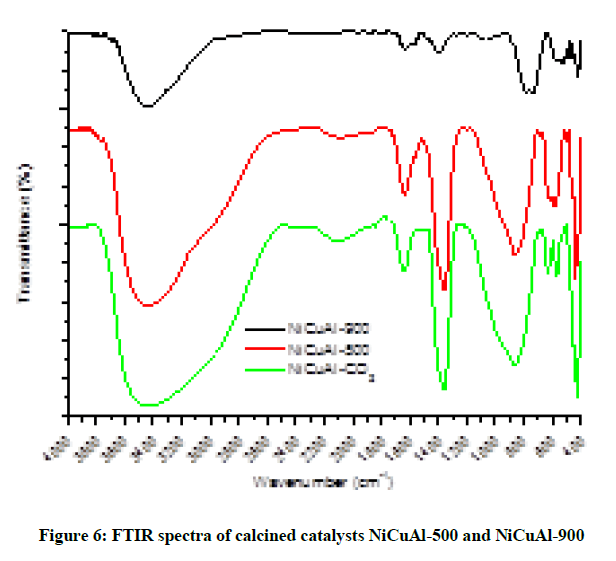
Figure 6: FTIR spectra of calcined catalysts NiCuAl-500 and NiCuAl-900
Catalytic activity of the catalysts
When it was used as catalyst in the peroxide oxidation of phenol, NiCuAl-CO3 exhibited high catalytic activity, as shown in Figure 7. It was seen that phenol could be completely oxidized within 15 min at 60°C in the coexisting system of catalyst and oxidant. On the contrary, in the presence of the catalyst alone or the oxidant alone, the removing rate of phenol after 4 h was only 7.61% and 5.89%, respectively.
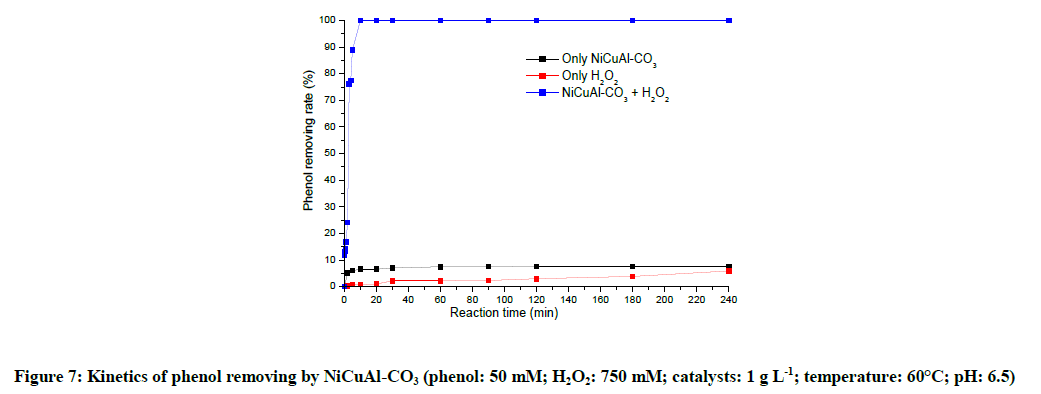
Figure 7: Kinetics of phenol removing by NiCuAl-CO3 (phenol: 50 mM; H2O2: 750 mM; catalysts: 1 g L-1; temperature: 60°C; pH: 6.5)
Influence of H2O2 amount, catalyst dosage and temperature on the conversion of phenol
Although the conversion rates of phenol increased with increasing n(H2O2)/n(phenol) molar ratio from 2.5 to 30, the increase of n(H2O2)/n(phenol) was unobvious at n(H2O2)/n (phenol) ≥ 15 (Figure 8a). On the other hand, when the catalyst dosage was increased from 0.1 gl-1 to 0.4 gl-1, the conversion rate increased obviously. However, at higher catalyst dosage such as 2.0 gl-1 the catalytic oxidation of phenol was weakened strongly (Figure 8b). In previous study [17,18], the same phenomenon was found for the catalytic peroxide oxidation of phenol over CuNiAlCO3. This was probably explained that higher amount of catalysts accelerated the decomposition of H2O2 and the subsequent formation of non-Fenton-type radicals which were ineffective to phenol oxidation.
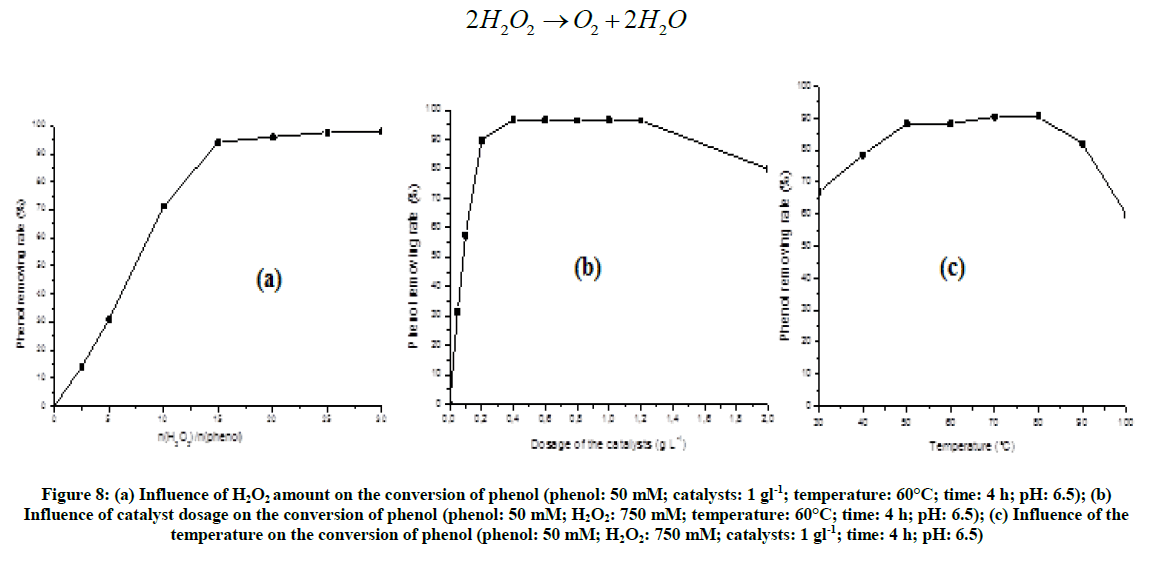
Figure 8: (a) Influence of H2O2 amount on the conversion of phenol (phenol: 50 mM; catalysts: 1 gl-1; temperature: 60°C; time: 4 h; pH: 6.5); (b) Influence of catalyst dosage on the conversion of phenol (phenol: 50 mM; H2O2: 750 mM; temperature: 60°C; time: 4 h; pH: 6.5); (c) Influence of the temperature on the conversion of phenol (phenol: 50 mM; H2O2: 750 mM; catalysts: 1 gl-1; time: 4 h; pH: 6.5)
The phenol removing conversion increased rapidly with the increase of temperature, with the values of 68% and 88%, respectively, at 30°C to 60°C (Figure 8c). Undoubtedly, higher temperature (>60°C) would be not unadvisable in view of the cost of oxidation reaction. Above 80°C, we noticed a reduction in the conversion of phenol; this could be due with the accelerated decomposition of H2O2 to water and oxygen with high temperature according to the reaction:
In any case, during CWPO reaction there was an appropriate ratio among phenol, H2O2 and catalyst, and here, we commended the values as follows:
0.4 gl−1 of catalyst and n(H2O2)/n(phenol)=15 for the oxidation of 50 mM of phenol.
Influence of calcination temperature of the catalyst on the conversion of phenol
The phenol oxidation is total over the catalyst NiCuAl-CO3, on the other hand over other catalysts (Table 2); we explain these results of with dimensions of the presence of the ions carbonates intercalated in the inter-layer spacing of the LDHs and adsorbed on the surface of catalyst, those ions can react with radical OH° to produce radicals carbonates and hydrogenocarbonates themselves reactive with many organic compounds, and they can accelerate the reaction of the oxidation of phenol [19]; of other with dimensions of well crystallized structure of catalyst with NiCuAl-CO3.
| Catalysts | Phenol removing rate (%) | Selectivity |
|---|---|---|
| NiCuAl-CO3 | 100 | Mélange |
| NiCuAl-500°C | 99.51 | Majorities |
| NiCuAl-900°C | 83.3 | Majorities |
Table 2: Conversion rate of phenol obtained by HPLC of each catalyst and their selectivity
Influence of nickel substitution by copper on the conversion of phenol
Table 3 summarizes catalytic oxidation of phenol over different catalysts. It was clear that copper is the catalytically active phase (activation sites for hydrogen peroxide) in view of the poor activity of NiAl-CO3. However, when nickel is introduced, a Jahn-Teller distortion for copper-based hydrotalcite-type, leading to poor long-range ordering of the crystals, might be weakened, as indicated in Figure 5 [19]. Therefore, nickel plays an indispensable role in catalytic peroxide oxidation of phenol over copper-based LDHs.
| Catalysts | Phenol removing rate (%) | Selectivity |
|---|---|---|
| NiAl-CO3 | 12.75 | No selectivity |
| NiCuAl-CO3 | 100 | Mélange |
| CuAl-CO3 | 100 | Majorities |
Table 3: Conversion rate of phenol obtained by CLHP of each catalyst
We can conclude that the catalyst NiCuAl-CO3 has a raised catalytic activity, while comparing with the catalysts rich in copper CuAlCO3 which present the presence of the impurities.
Conclusion
In this study, different LDHs catalysts CuAl-CO3, NiAl-CO3 and NiCuAl-CO3 were synthesized by the coprecipitation method. Appropriate heat treatments were carried out to give oxides derivatives of these LDHs. The X-ray diffraction analysis of those compounds showed the appearance of the hydrotalcite whose crystallinity increases with the increase in the quantity of copper. Those materials are then used as catalysts in the presence of hydrogen peroxide, an oxidizing agent. Various parameters have been optimized as they have an influence on the reaction, for example, the mass of the catalyst, the oxidant / substrate ratio, temperature of the degradation reaction and the initial pH of the solution. After comparative study among the catalysts studied, NiCuAl-CO3 shows a maximum activity with a total conversion of phenol (100%). An increase in the substrate ratio/catalyst increased the conversion of phenol.
References
- F. Cavani, F. Trifiro, A. Vaccari, Catal. Today., 1991, 11, 173-301.
- R. Chitrakar, Y. Makita, A. Sonoda, T. Hirotsu, J. Hazardous Mater., 2011, 185, 1435-1439.
- F. Boukraa Djellal Saiah, B.L. Su, N. Bettahar, J. Hazardous Mater., 2009, 165, 206-217.
- N. Benselka-Hadj Abdelkader, A. Bentouami, Z. Derriche, N. Bettahar, L.C. De Ménorval, Chem. Eng. J., 2011, 169, 231-238.
- F. Tzompantzi, G. Mendoza-Damian, J.L. Rico, A. Mantilla, Catal. Today., 2014, 220-222, 56-60.
- M. Wei, S. Shi, J. Wang, Y. Li, X. Duan, J. Solid State Chem., 2004, 177, 2534-2541.
- J.S. Valente, G. Rodriguez-Gattorno, M. Valle-Orta, E. Torres-Garcia, Mater. Chem. Phys., 2012, 133, 621-629.
- U. Costantino, F. Marmottini, M. Sisani, T. Montanari, G. Ramis, G. Busca, M. Turco Bagnasco, Solid State Ionics., 2005, 176, 2917-2922.
- D. Tichit, F. Medina, R. Durand, C. Mateo, B. Coq, J.E Sueiras, P. Salagre, Studies in Surface Science and Catalysis, 1997, 108, 297-304.
- N. Balsamo, S. Mendieta, M. Oliva, G. Eimer, M. Crivello, Procedia Mater. Sci., 2012, 1, 506-513.
- C.A.S. Barboza, P.M. Diaz, A.M. Da, C. Ferreira, V.R.L. Constantino, Appl. Clay Sci., 2005, 28, 147-158.
- S. Britto, P. Vishnu Kamath, J. Solid State Chem., 2009, 182, 1193-1199.
- H. Wang, X. Xiang, F. Li, D.G. Evans, X. Duan, Appl. Surf. Sci., 2009, 255, 6945-6952.
- G. De Souza, N.M. Balzaretti, N.R. Marcílio, O.W. Perez-Lopez, Procedia Engineering., 2012, 42, 335-345.
- S. Kannan, A. Narayanan, C.S. Swamy, J. Mater. Sci., 1996, 31, 2353.
- J. Barrault, M. Abdellaoui, C. Bouchoule, A. Majesté, J.M. Tatibouet, A. Louloudi, N. Papayannakos, N.H. Gangas, Appl. Catal. B: Environmental., 2000, 27, L225-L230.
- C. Catrinescu, C. Teodosiu, M. Macoveanu, J. Miehe-Brendlé, R. Le Dred, Water Res., 2003, 37, 1154-1160.
- P. Niang-Gay, N. Kappel Vel Leitner, Journal of Water Sciences., 2005, 18(1), 65-86.
- S. Kannan, A. Dubey, H. Knozinger, J. Catal., 2005, 231, 381-392.


