Research Article - Der Pharma Chemica ( 2018) Volume 10, Issue 8
Synthesis and Characterization of Co(Ii), Ni(Ii), Cu(Ii), and Zn(Ii) Complexes of Thiosemicarbazones
Jai Devi*, Manju Yadav and Som Sharma
Department of Chemistry, Guru Jambheshwar University of Science and Technology, Hisar-125001, Haryana, India
- *Corresponding Author:
- Jai Devi
Department of Chemistry
Guru Jambheshwar University of Science and Technology
Hisar-125001, Haryana, India
Abstract
Cobalt (II), nickel (II) copper (II) and zinc(II) complexes of Schiff bases [HL1-2] derived from 2,5-dichlorosalisaldehyde/2,5- dibromosalisaldehyde and 4-methyl-3-semicarbazide were synthesized. The structure of all the compounds have been evaluated on the basis of elemental analysis, molar conductance measurements and spectroscopic studies like Fourier-Transform Infrared (FTIR) spectroscopy, Ultraviolet-Visible (UV-Vis) spectroscopy, Nuclear Magnetic Resonance (NMR) spectroscopy, Erythrocyte Sedimentation Rate (ESR) and mass spectroscopy. The Schiff base ligands existed as NOS donor coordinating to metal ion through Azomethine nitrogen, sulphur of thiosemicarbazide and oxygen of deprotonated phenolic group forming complexes of the type [M(L1-2)2] in 1: 2 molar ratio. The spectroscopic data and physical measurement techniques suggested octahedral geometry around metal centers.
Keywords
Dibromosalisaldehyde, Spectroscopic studies, Thiosemicarbazide, Octahedral.
Introduction
Schiff-base ligands are versatile compounds synthesized by condensation between carbonyl compounds and primary amines. Schiff-base ligands can coordinate with different transition metal ions [1-3] and stabilize in various oxidation states. Schiff-base complexes show excellent catalytic activity [4] and exhibit broad range of biological activity [5,6]. Schiff-base complexes containing Co(II), Ni(II), Cu(II), and Zn(II) have been studied for enzymatic reactions [7], structure-redox relationships [8], magnetic properties [9,10], and used in coordination chemistry of transition metal ions [11].
Thiosemicarbazide based Schiff bases have been widely studied since 1950 due to their tendency to bind with metal centers [12] and also due to the fact that these molecules and their complexes have been used as therapeutics and imaging agents [13]. Also, literature shows that transition metal complexes of sulfur-nitrogen chelating agents, mainly those formed from thiosemicarbazide show variety of medicinal properties such as anticancer, antibacterial, antiviral, antitumour, antifungal, antimalarial etc. [14-19]. Thiosemicarbazides has also been used due to their variable applications in industry and analytical chemistry [20]. The molecules containing a chromophore based on the thiosemicabazide moiety has imported in increasing the light fastness [21]. Impressed by the applications of thiosemicarbazides, here in this paper we have reported the synthesis and characterization of Co(II), Ni(II), Cu(II), and Zn(II) complexes of Schiff base derived from 4-methyl-3-thiosemicarbazide and dihalosalicyaldehydes.
Material and Methods
Experimental Section
All chemicals were of analytical reagent grade having high purity, purchased from Sigma Aldrich and solvent used for synthesis, recrytalization and extraction of ligands and complexes were methanol, ethyl acetate, chloroform, Dimethyl sulfoxide (DMSO), Dimethylformamide (DMF) and diethyl ether [22]. Spectro grade solvents were used for spectral and conductance measurements. The CHN elemental analysis was performed using a Perkin-Elmer CHN 2400 elemental analyzer. Molar conductance measurements of compounds with concentration 10-3 mol. l-1 in DMSO were carried out using a Jenway 4010 conductivity meter. Proton Nuclear Magnetic Resonance (1H-NMR) spectra were measured using a Bruker 400 MHz spectrometer with DMSO as solvent; chemical shifts are given in parts per million (ppm) relative to tetramethylsilane. Electron impact mass spectra were recorded on a Jeol, JMS, DX-303 mass spectrometer. IR spectra (4000-400 cm-1) were recorded as KBr pellets on a Bruker Fourier-Transform Infrared (FTIR) spectrophotometer. Erythrocyte Sedimentation Rate (ESR) spectra of Cu (II) complexes were carried on a Varian E112X band spectrometer.
Synthesis of the Schiff base ligands
The Schiff bases (HL1) and (HL2) were formed by condensation of 4-methyl-3-thiosemicarbazide (0.012 gm, 1 mmol) with 2,5 dicholorosalicylaldehyde (0.019 g, 1 mmol) and 2,5 dibromorosalicylaldehyde (0.027 g, 1 mmol) in methanol solution. The reaction mixture was refluxed for 3 h and the solution was filtered. The yellow precipitate was washed several times with hot methanol and dried under vacuum and all organic impurities were then extracted by washing with diethyl ether. The purity of the ligands was confirmed by thin layer chromatography and the compositions of the ligands were confirmed by elemental analysis and spectroscopic techniques.
Synthesis of metal complexes
The metal complexes were prepared by adding Schiff base (HL1\HL2, 0.622\0.798, 2 mmol) to the appropriate metal salt, Cu(CH3COO)2.3H2O (0.198 g, 1.0 mmol), Ni(CH3COO)2.7H2O (0.240 g, 1.0 mmol) Co(CH3COO)2.4H2O (0.242 g, 1.0 mmol) and Zn(CH3COO)2.2H2O [0.201 g, 1.0 mmol) in 20 ml aqueous methanol in 2: 1 molar ratio. The reaction mixture was stirred in and heated on a hot plate at 60ºC for 100 min. The solid precipitate was obtained and volume of the obtained solution was reduced to one half by evaporation and after this the colored complexes formed were purified by washing with hot ethanol and diethyl ether and finally dried under vacuum (Scheme 1).
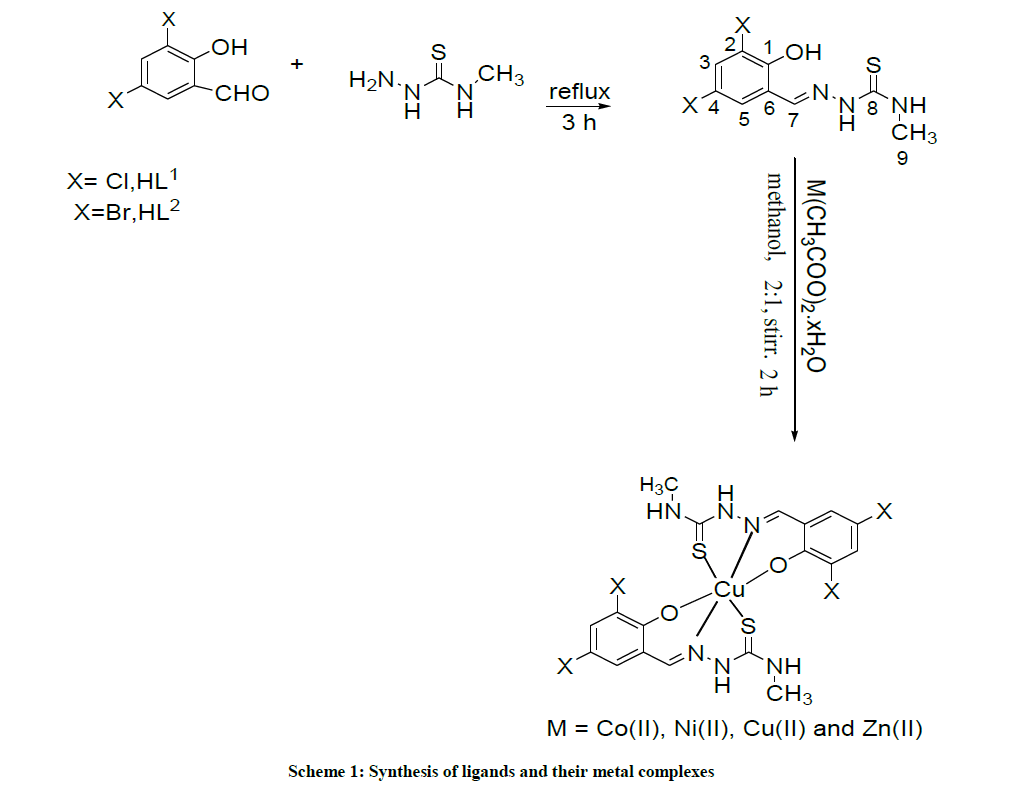
Scheme 1: Synthesis of ligands and their metal complexes
Results and Discussion
Condensation of the 2, 5 dihalosalicylaldehyde with 4-methyl-3-thiosemicarbazide readily gives the Schiff base ligands which were identified by Ultraviolet-Visible (UV), Infrared (IR), Nuclear Magnetic Resonance (NMR), and mass spectra. Six-coordinate complexes were obtained from 2: 1 molar ratio of Schiff base ligand with Cu(CH3COO)2.3H2O, Ni(CH3COO)2.7H2O, Co(CH3COO)2.4H2O and Zn(CH3COO)2.2H2O. The Schiff-base ligands and their complexes are highly stable at room temperature in solid state and these compounds are generally soluble in DMF and DMSO. The color, yield, elemental analysis, and molar conductance value of all the compounds are presented in Table 1. The analytical data are in agreement with the proposed stoichiometry of the complexes. The metal: ligand ratio in the complexes was found to be 1: 2. The molar conductivity values for all the compounds in DMSO was in the range 11-19 Ohm-1 cm2 mol-1, suggesting non electrolyte nature ligand and complexes (Table 1) [23]. IR, NMR, UV-Vis and ESR data indicate the complexes of the formation of tridentate ligands.
| Compound | M.F (M.W) | Color | Yield (%) | Elemental analysis (%) Cal. (found) | Ω×10-3 | |||
|---|---|---|---|---|---|---|---|---|
| C | H | N | M | |||||
| H L1 | C9H9Cl2N3OS | Yellow | 75 | 38.86 | 3.26 | 15.11 | - | 13 |
| -278.16 | -38.78 | -3.17 | -15.07 | |||||
| Co (L1)2 | C18H16Cl4CoN6O2S2 | Red brown | 73 | 35.25 | 2.63 | 13.7 | 9.61 | 16 |
| -613.33 | -35.17 | -2.57 | -13.65 | -9.55 | ||||
| Ni (L1)2 | C18H16Cl4NiN6O2S2 | Green | 64 | 35.27 | 2.63 | 13.56 | 9.57 | 18 |
| -615.15 | -35.19 | -2.57 | -13.48 | -9.52 | ||||
| Cu (L1)2. | C18H16Cl4CuN6O2S2 | Brown | 78 | 34.99 | 2.61 | 13.6 | 10.29 | 14 |
| -628.8 | -35.92 | -2.55 | -13.53 | -10.22 | ||||
| Zn (L1)2 | C18H16Cl4ZnN6O2S2 | White | 76 | 34.89 | 2.6 | 13.56 | 10.55 | 19 |
| -620.34 | -35.82 | -2.54 | -13.49 | -10.49 | ||||
| H L2 | C9H9Br2N3OS | Yellow | 75 | 29.45 | 2.47 | 11.45 | - | 11 |
| -367 | -29.38 | -4.87 | -4.87 | |||||
| Co (L2)2 | C18H16Br4CoN6O2S2 | Red brown | 73 | 27.33 | 2.04 | 10.62 | 7.45 | 15 |
| -791.33 | -27.21 | -2.01 | -10.55 | -7.38 | ||||
| Ni (L2)2 | C18H16Br4NiN6O2S2 | Green | 64 | 27.33 | 2.04 | 10.62 | 7.42 | 12 |
| -793.15 | -27.23 | -1.97 | -10.54 | -7.35 | ||||
| Cu (L2)2 | C18H16Br4CuN6O2S2 | Brown | 78 | 27.17 | 2.03 | 10.56 | 7.99 | 14 |
| -795 | -27.11 | -1.96 | -10.51 | -7.92 | ||||
| Zn (L2)2 | C18H16Br4ZnN6O2S2 | White | 76 | 27.11 | 2.02 | 10.54 | 8.2 | 17 |
| -796.34 | -27.07 | -1.95 | -10.49 | -8.13 | ||||
M.W=Molecular Weight, M.F= Molecular formula; Ω× 10-3= molar conductivity (Ohm-1 cm2 mol-1)
Table 1: Physical and analytical data of compounds
IR Spectra
An IR spectrum gives enough information to elucidate the way of bonding of the ligands to the metal ions. The IR spectra of compounds were recorded in the range of 400-4000 cm-1 and band assignments are reported in Table 2. The most characteristic vibrations are selected by comparing the IR spectra of the ligands with those of their metal complexes. The strong bands at 1595-1585 cm-1 for free ligand is due to the azomethine vibration mode, ν(C= N) which gets shifted to the higher frequency in the range of 1630-1608 cm-1 on complexation to metal atom. Ligands display band at 3250-3238 cm-1 which are assigned to OH vibration modes and this bands gets disappeared after complexation [24]. The sharp and distinct bands present in the far infrared spectra of all complexes at 541-522 cm-1 and 457-427 cm-1, 393-365 cm-1 provide a compelling evidence for the presence of metal–oxygen, metal-nitrogen and metal-sulphur bond, respectively [25].
| Compound | (-OH) | (-C=N) | (-C=S) | (-NH) | (M-N) | (M-O) | (M-S) |
|---|---|---|---|---|---|---|---|
| HL1 | 3250 | 1585 | 805 | 3220 | - | - | - |
| Co (L1)2 | - | 1630 | 845 | 3265 | 457 | 541 | 393 |
| Ni (L1)2 | - | 1608 | 827 | 3275 | 431 | 525 | 375 |
| Cu (L1)2 | - | 1618 | 823 | 3271 | 429 | 527 | 371 |
| Zn (L1)2 | - | 1616 | 838 | 3258 | 441 | 535 | 365 |
| HL2 | 3238 | 1595 | 810 | 3260 | - | - | - |
| Co (L2)2 | - | 1640 | 848 | 3323 | 452 | 538 | 397 |
| Ni (L2)2 | - | 1618 | 831 | 3338 | 437 | 522 | 383 |
| Cu (L2)2 | - | 1627 | 828 | 3319 | 427 | 525 | 375 |
| Zn (L2)2 | - | 1625 | 841 | 3327 | 439 | 531 | 370 |
Table 2: IR spectral data (Ν Cm−1) of compounds
NMR Spectra
1H-NMR spectra of Schiff bases and their complexes were recorded in DMSO and all chemical shifts were reported in parts per million relative to TMS as internal standard (Table 3). The free ligands showed singlet at δ 8.03- 8.05 ppm due to Azomethine proton which gets shifted on complexation to metal atom. The phenolic-OH proton showed singlet at δ 9.87- 9.89 ppm which gets disappeared in the spectra of zinc complexes suggested coordination of phenolic-OH group to metal ion. The (N-NH) proton appeared at δ 9.15-9.12 ppm and δ 6.97-6.95 ppm (- NH-R) which also gets shifted when complexes are formed. The aromatic proton appeared in range of δ 7.45-7.34 ppm which also gets shifted suggested coordination.
| 1H-NMR | (O-H), (N-NH), (R-NH) | -CH=N- (Azomethine) | Aromatic | -CH3- |
|---|---|---|---|---|
| HL1 | 9.87 (s, 1H, -OH) | 8.03 (s, 1H,-CH=N-) | 7.43 (d, 1H, C3, Ar-H), 7.34 (d, 1H, C5, Ar-H) | 3.30 (d, 3H) |
| 9.12 (s, 1H, -N-NH) 6.95 (s, 1H, R–NH) | ||||
| HL2 | 9.89 (s, 1H, -OH) | 8.05 (s, 1H, -CH=N-) | 7.45 (d, 1H, C3 Ar-H), 7.36 (d, 1H, C5, Ar-H) | 3.32 (d, 3H) |
| 9.15 (s, 1H, - N-NH) 6.97 (s, 1H R-NH) | ||||
| Zn (L1)2 | 8.31 (s, 1H,-N-NH) 6.72 (s, 1H R-NH) | 8.29 (s, 1H,-CH=N-) | 7.27 (d, 1H, C3, Ar-H), 7.20 (d, 1H, C5, Ar-H) | 2.75 (d, 3H) |
| Zn (L2)2 | 8.33 (s, 1H, N-NH) | 8.31 (s, 1H, CH=N-) | 7.28 (d, 1H, C3 Ar-H), 7.21 (d, 1H, C5, Ar-H) | 2.78 (d, 3H) |
| 6.74 (s, 1H –NH) | ||||
| 13C-NMR | (C=S) | -CH=N- (Azomethine) | Aromatic | -CH3- (methyl) |
| HL1 | 178.02 | 152.58 | 138.58 (-C-OH, C1), 135.40 (-CH-, C3), 129.17 (-CH-, C5), 125.62 (C6) 113..42 (CBr, C4), 112.08 (-C-Br, C2) | 30.38 |
| HL2 | 178.07 | 155.43 | 138.22 (-C-OH, C1), 135.42 (-CH-, C3), 129.19 (-CH-, C5), 125.14, (-C-, C6) 113.42 (-C-Br, C4), 112.08 (-C-Br, C2) | 30.33 |
| Zn (L1)2 | 178.42 | 152.21 | 138.22 (-C-OH, C1), 135.42 (-CH-, C3), 129.19 (-CH, C5), 125.14 (-C-, C6), 113.82 (-C-, Br, C4), 112.08 (-C-Br, C2) | 30.98 |
| Zn (L2)2 | 178.53 | 155.32 | 138.22 (-C-OH, C1), 135.42 (CH, C3) | 30.87 |
| 129.19 (-CH-, C5), 125.14 (-C-, C6), 113.42 (-C-Br, C4), 112.38 (-C-Br, C2) |
Table 3: 1H and 13C-Nmr spectral characteristics (Δ In Ppm) of Schiff bases and its zinc metal complexes
In 13C-NMR of Zn complexes shifting of signals of Azomethine carbon (–CH=N–) of Schiff base ligands from δ 152.58 to δ 152.51 ppm (HL1) and δ 155.43 to δ 155.32 ppm (HL2), signal of carbon attached to thiocarbonyl group shift from δ 178.07-178.02 ppm to δ 178.53-178.42 ppm. When coordinated to Zn(II) ions the other carbon atoms were observed in the range of δ 138.58-112.08 and remains almost unaltered on complexation.
Electronic Spectra
The electronic spectra of the complexes were recorded in DMSO solution (Table 4). Electronic spectra of Co(II) complexes are characterized by three bands in the regions 25431-25483 cm-1, 17645-17704 cm-1, 9345-9412 cm-1 and these spectral bands are due to 4T1g→4T1g(P) 4T1g→4T2g (F), 4T1g→4A2g (F) transitions. Electronic spectra of Ni(II) complexes shows three electronic spectral bands in the range of 28245-28263 cm-1, 19432-19535 cm-1 and 11567-11627 cm-1. These bands are due to 3A2g(F)→3T1g(P) (ν1), 3A2g(F)→3T1g(F) (ν2), 3A2g(F)→3T2g(F) (ν3 transitions respectively. The position of bands indicates that these complexes have octahedral geometry. In copper complexes one band at 11653-11697 cm- 1is due to d-d transitions and the spectrum also displayed a broad band in the range 22823-22908 cm-1. This band corresponded to the transition 2B1g→2A1g). The electronic spectra of the zinc(II) complexes showed one high-intensity band at 38453-38496 cm-1 is due to LMCT transition and a band at 28830-28867 cm-1 is due to π→π* transitions. So from the magnetic moment value in Table 4 electronic transitions show that all the complexes are octahedral in nature.
| Ligand/Complex | absorption [cm-1] | Band assignment | μeff (BM) | Geometry |
|---|---|---|---|---|
| [HL1, HL2] | ||||
| [HL1, HL2] | [30845, 31645] | π→π*transitions | - | |
| [29347, 29735] | n→π*transitions | |||
| Co (L1)2, Co (L2)2 | [25431, 35483] | π→π* transitions | [5.18, 5.88] | octahedral |
| [17645, 17704] | n→π* transitions | |||
| [9345, 9415] | d-d transitions | |||
| Ni (L1)2, Ni (L2)2 | [28245, 28283] | π→π*transitions | [3.73, 3.87] | octahedral |
| [19432, 19539] | n→π*transitions | |||
| [11567, 11627] | d-d transitions | |||
| Cu ( L1)2, Cu (L2)2 | [22823, 22908] | n→π* transitions | [1.79, 1.83] | octahedral |
| [11653, 11793] | d-d transitions | |||
| Zn ( L1)2, Zn (L2)2 | [28830, 28867] | π→π* transitions | diamagnetic | octahedral |
| [38456, 38496] | LMCT |
Table 4: Electronic absorption spectral data and magnetic moment of complexes
Molar conductivities
Conductivity measurement in non-aqueous solutions is used for testing the degree of ionization of the complexes. The conductivity data reported for 10-3 M solution for these complexes are given in Table 1. The conductivity data shows that the complexes are nonelectrolytes.
ESR Spectra
The X-band EPR spectrum of the Cu(II) complexes were recorded in the solid state at room temperature. The ESR spectral studies of Cu(II) complexes gives information about the distribution of unpaired electron and nature of bonding between the metal ion and its ligands. In the present study, ESR spectra of [Cu(L1 )2] had values g׀׀=2.83; g⊥=2.43 and [Cu(L2 )2] (Figure 1) had values g׀׀=2.69; g=2.33 and the trend g׀׀>g⊥ observed indicated that the unpaired electrons are most likely to be in the dx 2 -y 2 orbital. For the complex, the observed g values are gll>g⊥>2.0023 which shows that the complexes has an octahedral geometry and the ground state is 2B1g. In the axial spectra, the g-values are related with the exchange interaction coupling constant G by the expression
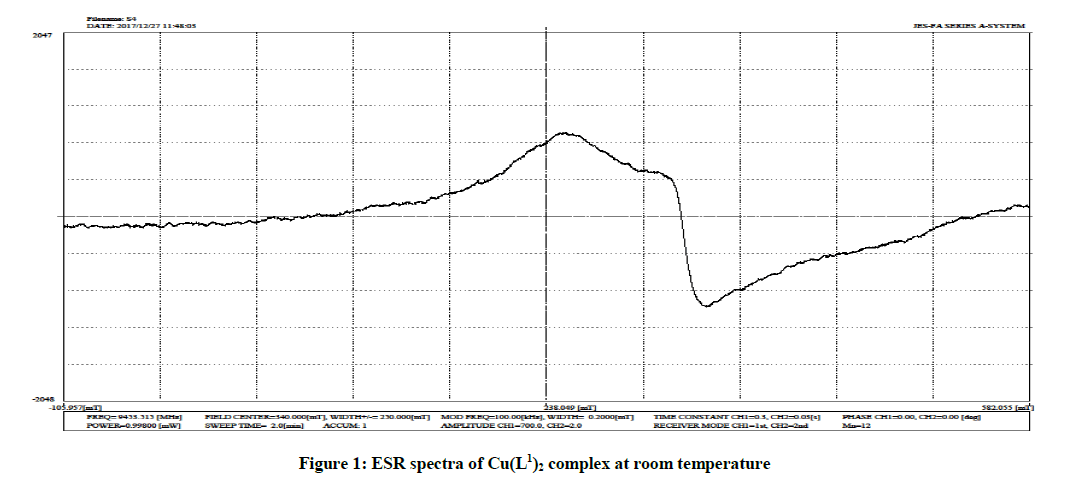
Figure 1: ESR spectra of Cu(L1)2 complex at room temperature
G=gll-2. 0023/g⊥-2.0023
According to Hathaway if G value is larger than four, the exchange interaction is negligible because the local tetragonal axes are aligned parallel or slightly misaligned. In the present Cu (L1)2 complex G value 2.00 and Cu(L2)2 complex G value is 2.0057, which shows exchange interaction in solid Cu(II) complexes.
Mass Spectra
The mass spectra of Schiff base and their complexes were recorded and are reported in Table 1. The mass spectrum of HL1 shows a well-defined molecular ion peak at m/z 278.16, which matches with a formula weight of Schiff base ligand. Likewise its mass spectrum of Ni (L1)2 complex shows a molecular ion peak at m/z 615.12.
Conclusion
Co(II), Ni(II), Cu(II), and Zn(II) complexes containing tridentate ONS chelating ligands obtained from substituted salicylaldehyde with thiosemicarbazide have been prepared and characterized by elemental analysis, molar conductance, spectroscopic studies (infrared, mass, NMR and ESR. Under experimental conditions employed, only 1: 2 (M: L) complexes have been found. Characterization shows that complexes are hexadentate in nature by coordinating in oxygen of phenolic group, nitrogen of Azomethine group and sulphur of thiocarbonyl group to metal ions with octahedral geometry.
Acknowledgement
Author Som Sharma and Manju Yadav are greatful to DST PURSE and GJUS&T, Hisar for Financial support by granting research project.
References
- A.H. Osman, Transition Met. Chem., 2006, 31, 35.
- J. Devi, S. Devi, A. Kumar, Med. Chem. Commun., 2016, 7, 932.
- C. Sousa, C. Freire, B. de Castro, Molecules., 2003, 8, 894.
- J. Costamagna, J. Vargas, R. Latorre, A. Alvarado, G. Mena, Coord. Chem. Rev.,1192, 119, 67.
- M. Cindric, N. Strukan, V. Vrdoljak, T. Kajfez, B. Kamenar, Croatica Chim. Acta., 2003, 76, 157.
- D.E. Hamilton, R.S. Drago, A. Zombeck, J. Am. Chem. Soc., 1987, 109, 374.
- J.M. Bindlish, S.C. Bhatia, P. Gautam, P.C. Jain. Indian J. Chem., Sect. A, 1978, 16, 279.
- I. Bernal, Stereochemical Control, Bonding and Steric Rearrangements, Chap-3, Elsevier, Amsterdam, 1990.
- K.K. Chaturvedl, J. Inorg. Nucl. Chem.,1993, 39, 901.
- R.D. Archer, B. Wang, Inorg. Chem., 1990, 29, 39.
- R.G. Xiong, B.L. Song, J.Z. Zuo, X.Z. You, Polyhedron, 1996, 15, 903.
- T.S. Lobana, R. Sharma, G. Bawa, S. Khanna, Coord. Chem. Rev., 2009, 253, 977.
- J.R. Dilworth, R. Hueting, Inorg. Chim. Acta., 2012, 3, 389.
- V. Philip, V. Suni, M.R.P. Kurup, M. Nethaji, Polyhedron., 2006, 26, 1931.
- F.A. French, E.J. Blanz Jr, J. Med. Chem., 1996, 9, 585.
- M. Das, S.E. Livingstone, Br. J. Cancer, 1978, 9, 466.
- A.S. Dobek, D.L. Klayman, E.T. Dickson, J.P. Scovill, E.C. Tramont, Antimicrob. Agents Chemother., 1980, 18, 27.
- C. Shipman, J.R. Smith, J.C. Drach, D.L. Klayman, Antiviral Res., 1986, 6, 197.
- M. Muralisankar, S. Sujith, N.S.P. Bhuvaneshb, A. Sreekantha, Polyhedron., 2016.
- M. Kabil, S. Ghazy, A. El-Asmy, Y. Sherif, Anal. Sci., 1996, 12, 431.
- G. Hazmi, M. Shahawi, A. El-Asmy, Trans. Met. Chem., 2005, 30, 464.
- K.S. Kuamr, C.P. Varma, V.N, Reena, K.K. Aravindakishan, J. Pharm. Sci. Res.,2017, 9, 131.
- J. Devi, N. Batra, S. Sharma, J. Yadav, R. Malhotra, Der Pharma Chemica., 2017, 9, 97,
- J. Devi, N. Batra, Spectrochim. Actta.,2015, 135, 710.
- M.M. Abd-Elzaher, Appl. Organometal. Chem.,2004, 18, 149.


