Research - Der Pharma Chemica ( 2023) Volume 15, Issue 4
Development of Stability Indicating Assay Method for Estimation of Olmesartan Medoxomil and Chlorthalidone in Its Combined Dosage Form
Anekar VP*, Charde MS and Chakole RDAnekar VP, Department of Pharmaceutical Chemistry, Government College of Pharmacy, Vidyanagar, Karad, Dist.: Satara Pin- 415124, Maharashtra, India, Email: vaishnavianekar8@gmail.com
Received: 03-Apr-2023, Manuscript No. dpc-23-94022; Editor assigned: 05-Apr-2023, Pre QC No. dpc-23-94022; Reviewed: 19-Apr-2023, QC No. dpc-23-94022; Revised: 21-Apr-2023, Manuscript No. dpc-23-94022; Published: 28-Apr-2023, DOI: 10.4172/0975-413X.15.4.14-23
Abstract
Performance liquid chromatographic method was developed for estimation of two Anti-hypertensive drugs, Olmesartan medoxomil and Chlorthalidone. The separation of both the drugs was achieved on Phenomenex kinetex XB C-18 column (150 mm X 4.6 mm , 5μ particle size) using mobile phase Acetonitrile : 0.1% TFA Water (45:55v/v). The flow rate was 1 ml/ minute with run time 10 minutes and detection was done at 235 nm. The retention time of Olmesartan medoxomil and for Chlorthalidone was 2.15 min. and 1.71 min. respectively. The linearity of the method was evaluated at a range of 50 to 150 μg/ml and 31.25 to 93.75 μg/ml for Olmesartan medoxomil and Chlorthalidone respectively. The Correlation Coefficient of Olmesartan medoxomil and Chlorthalidone were 0.999 each. Precision studies were carried out and %RSD of peak areas of Olmesartan medoxomil and Chlorthalidone was about 0.051 and 0.077 respectively. The percentage recoveries of both the drugs OLM and CHL from the tablet formulation were 98.27% and 98.33% respectively. The developed method has been statistically validated according to ICH guidelines and found to be simple, cost-effective, linear, precise, and accurate with the prescribed values. Thus this method can successfully employ for simultaneous estimation of both drugs in commercial products.
Keywords
Olmesartan medoxomil; Chlorthalidone; RP-HPLC; Stability
List of abbreviations used
CHL: Chlorthalidone OLM: Olmesartan Medoxomil Abs: Absorbance Conc.: Concentration S.D.: Standard Deviation R.S.D.: Relative Standard Deviation. H.P.L.C.: High Performance Liquid Chromatography.
INTRODUCTION
Combinations of two or more drugs in the Pharmaceutical dosage forms are very much useful in multiple therapies. Market survey revealed that, day-by-day new drugs and their combination with another drugs are being introduced in market as they have more patient compliance than a single drug [1]. The analytical chemistry hence has challenge in developing the methods for their analysis with the help of number of analytical techniques, which are available for the estimation of the drugs and their combination [2]. Analytical monitoring of pharmaceutical product or of specific ingredients within the product is necessary to ensure the safety and efficacy throughout the shelf life, including storage, distribution and use [3]. The Olmesartan medoxomil and Chlorthalidone fixed-dose combination is found to show superior antihypertensive efficacy in blood pressure reduction in patients with hypertension.
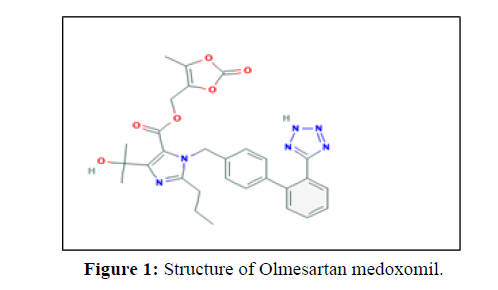
Olmesartan Medoxomil is an Angiotensin receptor antagonist with the chemical name (5-methyl-2-oxo-2H-1,3-dioxol-4-yl)methyl4-(2-hydroxypropan-2-yl)-2-propyl-1-({4-[2-(2H-1,2,3,4-tetrazol- 5-yl)phenyl]phenyl}methyl)-1H-imidazole-5-carboxylate. It is BCS class drug (low solubility, high permeability) & having the white to light yellowish-white crystalline appearance [4-10].
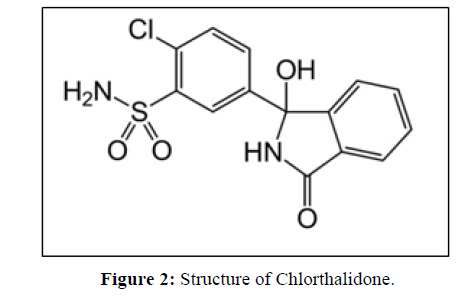
Chlorthalidone is a diuretic agent involved in the treatment of hypertension. It is a sulfonamide derivative with different chemical structure from thiazide but the same pharmacological actions as that of thiazide diuretic with the chemical name 2-chloro-5-(1-hydroxy-3-oxo-2,3-dihydro-1H-isoindol-1-yl) benzene-1-sulfonamide. It is BCS class IV drug (low solubility, low permeability) which is having white or yellowish-white crystalline appearance (Figures 1,2).
The present work was undertaken to develop such method of analysis, which can estimate both the drugs in combination which is a precise, accurate, simple, reliable and less time consuming method for estimation of drugs in tablet.
EXPERIMENTAL
Material and Reagents
Olmesartan medoxomil and Chlorthalidone was provided by Aarti Pharmaceuicals, (Mumbai,India). Pharmaceutical formulation of tablets containing Olmesartan medoxomil 20 mg and Chlorthalidone 12.5 mg was purchased from local commercial sources. HPLC grade acetonitrile, water and methanol were procured from Fisher scientific chemicals, Mumbai and TFA was procured from Loba chemie, Mumbai. All solutions were filtered through a Millipore vacuum filter system (0.22 μm) and degassed by the sonicator.
Instrument
A HPLC system consisted of LC solution data handling system (HPLC SYS-LC- 138 Systronics), 80 plus intelligent UV/VIS detector, micro-syringe SGE analytical science; Australia was used for injecting the samples. Data acquisitions were performed by using Clarify software. Ultrasonic bath sonicator was used for degassing of the mobile phase. Weighing of the materials was carried out on a Mettler balance with high degree of accuracy.
Methods
Determination of wavelength for detection of OLM and CHL
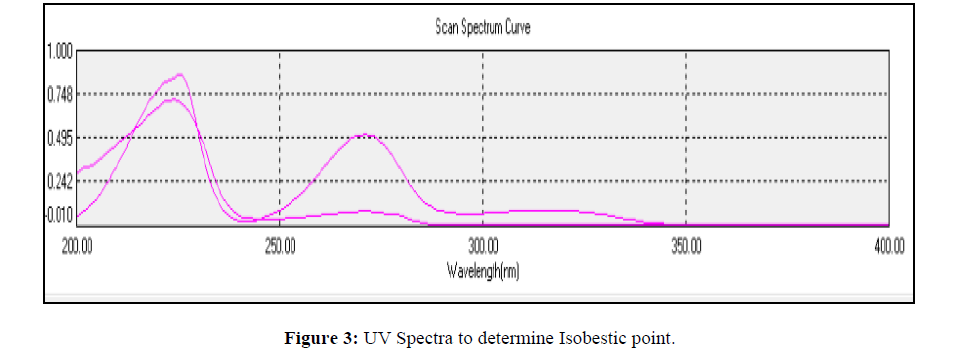
The suitable wavelength for detection of OLM and CHL was selected from overlain spectrum of OLM and CHL, wavelength selected was 235 nm.
Selection of mobile phase
Based on sample solubility, stability, suitability various mobile phases and compositions were tried to get a good resolution and sharp peak.
The following mobile phases were tried:
1. Methanol: Water [40: 60 %v/v]
2. Acetonitrile: Water [30: 70 %v/v]
3. ACN: Methanol: Water [30:10: 60 % v/v]
4. ACN: 0.1% TFA Water [35: 65 %v/v]
5. ACN: 0.1 % TFA Water [45: 55 %v/v]
Each mobile phase was filtered through Millipore vacuum filter system (0.22 μm) and degassed by sonication for 20 minutes. From the various mobile phases tried, mobile phase containing ACN and 0.1 % TFA Water in 45: 55 %v/v proportion was selected, since it gave completely resolved peaks with symmetry within limits and significant retention times for both the drugs (Table 1).
| Chromatographic mode | Chromatographic conditions |
|---|---|
| Stationary phase | Phenomenex Kinetex XB-C18 (150mm x 4.6 mm, 5µ) |
| Standard solution | 100 µg/ml OLM & 100 µg/ml CHL |
| Column Oven Temp | 30ºC |
| Mobile Phase | ACN: (0.1%) TFA Water (45:55 v/v) |
| Flow rate | 1 ml/min |
| Sample size | 10µl |
| Run Time | 10 minutes |
| Detection Wavelength | 235nm |
| Diluent | ACN : Water (50:50) |
Chromatographic conditions
Selection of chromatographic conditions
The selection of RP-HPLC method for separation depends upon the nature of the sample, it’s molecular weight and solubility. 27 The chromatographic variables such as mobile phase, flow rate and solvent ratio were studied. The resulting chromatograms were recorded and the chromatographic parameters such as selectivity, asymmetric factor, and peak resolution were calculated. The condition that gave the best resolution, symmetry and selectivity was selected for estimation.
Optimization of Chromatographic Parameters
Optimisation in HPLC is the process of finding a set of conditions that adequately analyze the quantification of the analyte with acceptable accuracy, precision, sensitivity, specificity, cost, ease, and speed of analysis.
Optimization of Mobile phase strength
Different trials and error are carried out on Water, Methanol and Acetonitrile by changing different mobile phase ratio and different stabilizers to resolve both peaks. Stabilizers like Ortho Phosphoric acid, Mono potassium phosphate, TFA etc. Mobile phase is optimized as the minimum quantity of buffer and Acetonitrile should be used to carry out separation of peak of both the drugs because buffer may damage the column chemistry as they bind most to bonded phase and Acetonitrile is best solvent for column but that is too expensive, so to develop precise an economical method their concentrations are minimized. TFA (Trifluoroacetic acid) was used in mobile phase to make low pH buffer. TFA is more advantageous over all other acid as it improves resolution and sharpens the peak; it is volatile, easily removed and it is having low absorption within detection wavelength. Finally, mobile phase containing Acetonitrile and 0.1 % TFA Water in 45:55 % v/v proportions was found to give best resolution for both the drugs.
Selection of wavelength maxima
Olmesartan Medoxomil showed absorption maxima at 255 nm and Chlorthalidone showed at 268 nm. For simultaneous estimation a common wavelength i.e. isobestic point for detection was selected at 235 nm which is shown in Figure 3.
Preparation of mobile phase
450 ml of Acetonitrile & 550 ml of 0.1% TFA HPLC grade water measured with help of measuring cylinder and transferred to 1000 ml of volumetric flask. Then this mobile phase is sonicated for 10 minutes.
Standard and working standard
Accurately weighed 10 mg of standard Olmesartan medoxomil and Chlorthalidone and dissolved into 100 ml mobile phase to obtain the final concentration of 100 μg/ml. Appropriate dilutions were made into 10 ml volumetric flask with the mobile phase to produce working solutions in the concentrations range 50-150 μg/ml and 31.25-93.75 μg/ml for Olmesartan medoxomil and Chlorthalidone respectively. 10μl of samples were injected into the chromatographic system and peak areas were measured.
Sample solution
The sample solution of formulation product is prepared by taking average of the 20 tablet and crushed into a mortar by using the pestle and accurately weighing of equivalent weight of powdered tablet containing 10 mg of OLM and 6.25 mg of CHL and dissolved in 10ml of diluent, shake it for 5 minutes for complete dissolution of the powdered material and then 0.45 micron filter was used to remove insoluble material from solution and then sonicated for 5 minutes and then 1 ml of above solution was further diluted to 10 ml of diluent, Finally the remaining volume is make upto the mark by mobile phase. Injected 10 μl of filtered portion of the sample and standard preparation into the chromatographic system. Record the responses for the major peaks. Calculated the content of Olmesartan medoxomil and Chlorthalidone present in each tablet.
Linearity Study of Drug at Selected Wavelength
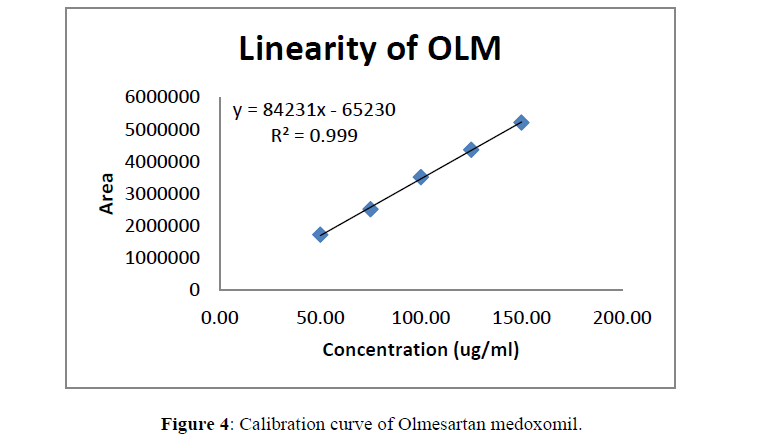
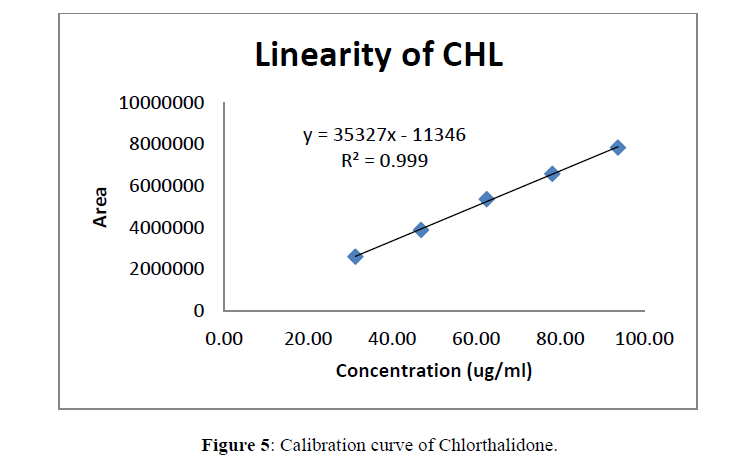
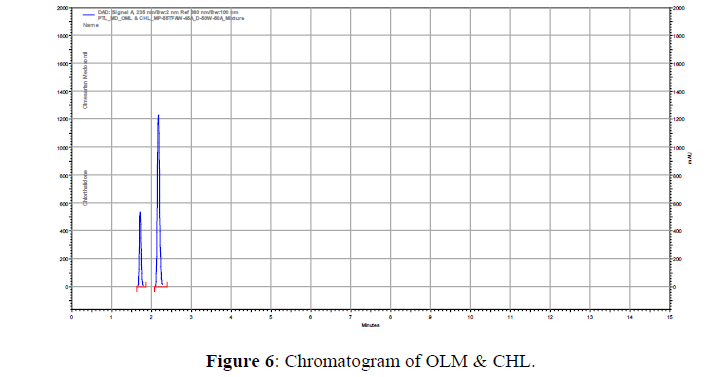
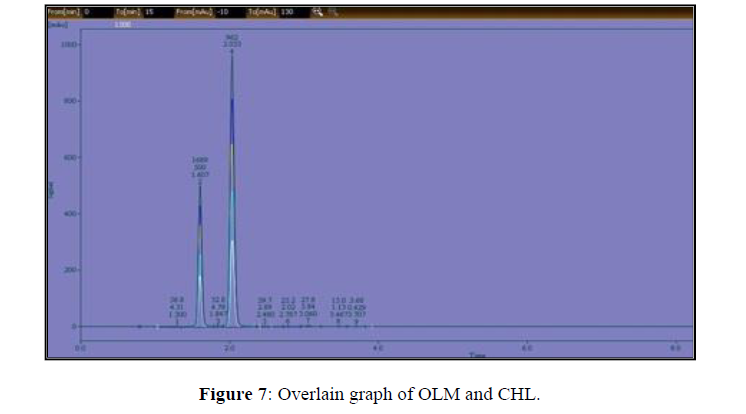
Appropriate aliquots of STD Stock Solutions of OLM and CHL were prepared in combined form and transferred to series of 10ml volumetric flasks respectively. Volume made to the mark to get Solution of drug in different concentrations level at 50-150 μg/ml of OLM & 31.25-93.75μg/ml of CHL. 10μL injection of each concentration of the drug were injected into HPLC system three times separately and chromatogram was obtained. Evaluation of the drug was performed with the UV detector set as 235 nm and peak area Vs concentration response was recorded. According to ICH Guidelines n>5 i.e. using minimum 5 concentrations (50,75,100,125,150) were taken (Figures 4-7).. A linear relationship evaluated across the range of analytical procedure. Which is shown in Tables 2, 3.
| Sr.no. | Conc. (µg/ ml) | Peak 1 | Peak 2 | Peak 3 | Average | SD | %RSD |
|---|---|---|---|---|---|---|---|
| 1 | 50 | 2601 | 2603 | 2604 | 2602 | 1.527 | 0.058706 |
| 2 | 75 | 3885 | 3887 | 3885 | 3886 | 1.154 | 0.029714 |
| 3 | 100 | 5360 | 5363 | 5361 | 5361 | 1.527 | 0.028493 |
| 4 | 125 | 6577 | 6574 | 6577 | 6576 | 1.732 | 0.026339 |
| 5 | 150 | 7838 | 7839 | 7838 | 7838 | 0.577 | 0.007366 |
| Avg. | 1.303 | 0.0301 | |||||
| Sr. no. | Conc. (µg/ ml) | Peak 1 | Peak 2 | Peak 3 | Average | SD | %RSD |
|---|---|---|---|---|---|---|---|
| 1 | 31.25 | 1723 | 1724 | 1725 | 1724 | 1.00 | 0.058005 |
| 2 | 46.88 | 2515 | 2518 | 2518 | 2517 | 1.732 | 0.068814 |
| 3 | 62.50 | 3515 | 3512 | 3514 | 3513 | 1.527 | 0.043482 |
| 4 | 78.13 | 4367 | 4366 | 4364 | 4366 | 1.527 | 0.034987 |
| 5 | 93.75 | 5218 | 5217 | 5215 | 5216 | 1.527 | 0.029285 |
| Avg. | 1.462 | 0.04691 | |||||
Analysis to Marketed Formulations
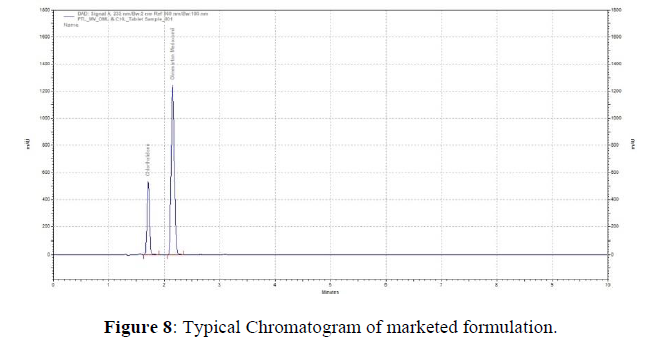
For the present work Olmesar CH-20 (Macleods) has 20 mg OLM and 12.5 mg CHL was selected for the analysis. The percentage drug content was calculated by measuring the peak area and comparing with the pure OLM and CHL of respective concentration. The statistical data obtained after replicate determinations (n = 6) is shown in Table 4 and chromatogram is shown in Figure 8.
| Formulation Olmesar CH-20 (Macleods) |
Label claim (mg/tab) |
Conc. µg/ ml | Area | Amount found µg/ml | Amount found (mg/tab) |
%Assay= [sample area/std area]*100 |
|---|---|---|---|---|---|---|
| OLM | 20 | 998 | 10183158 | 100.11 | 20.06 | 100.11 |
| CHL | 12.5 | 625 | 3477630 | 99.86 | 12.41 | 99.86 |
Recovery Studies
Accuracy of analysis was determined by performing recovery studies by spiking different concentrations of pure drug in the preanalyzed tablet sample. Results of recovery studies indicated that the method is rapid, accurate and reproducible and is shown in Table 5.
| OLM | CHL | |||||||
|---|---|---|---|---|---|---|---|---|
| Level | Conc. | % REC |
Mean of % recovery |
%RSD | Conc. | % Recovery | Mean of % recovery |
%RSD |
| 75% | 20 | 96.68 | 98.27 98.28 | 0.63 | 12.5 | 95.54 | 98.33 | 0.51 |
| 100% | 20 | 99.99 | 0.11 | 12.5 | 100.02 | 0.33 | ||
| 125% | 20 | 98.16 | 0.62 | 12.5 | 99.43 | 0.52 | ||
| *Obtained from 6 determinations, S.D: Standard deviation, R.S.D: Relative standard deviation. | ||||||||
System Suitability Parameters
System suitability parameters were analyzed on freshly prepared standard stock solutions of OLM and CHL. Both the drugs were injected into the chromatographic system under the optimized chromatographic conditions. Parameters were validated according to ICH Q2B guidelines for validation of analytical procedures in order to determine the linearity, sensitivity, precision and accuracy for the analyte. The suitability of the system were
a) Retention time
b) Number of theoretical plates
c) Tailing/ asymmetric factor
d) Limit of Detection
e) Limit of quantitation
f) Resolution
g) Calibration Range (μg ml -1)
The results are shown in Table 6.
| Sr. No. | Parameters | OLM | CHL |
|---|---|---|---|
| 1 | Retention time | 2.15min | 1.71min |
| 2 | Theoretical plate | 6587.4 | 6732 |
| 3 | Asymmetry | 1.25 | 1.078 |
| 4 | LOD | 9.42 | 2.67 |
| 5 | LOQ | 28.54 | 8.08 |
| 6 | Resolution | 4.61 | 0.0 |
| 7 | Calibration Range (µg ml -1) | 50-150 | 31.25-93.75 |
| OLM | CHL | |||||
|---|---|---|---|---|---|---|
| Parameters | % assay | % degradation | % RSD | % assay | % degradation | % RSD |
| Acid | 82.44 | 17.56 | 0.391 | 73.85 | 26.15 | 0.582 |
| Base | 98.70 | 1.30 | 0.514 | 94.36 | 5.64 | 0.638 |
| Oxidative | 95.13 | 4.87 | 0.652 | 97.01 | 2.99 | 0.531 |
| Thermal | 95.42 | 4.58 | 0.611 | 91.26 | 8.74 | 0.125 |
| Photolytic | 96.53 | 3.47 | 0.696 | 98.30 | 1.70 | 0.512 |
Stability Study
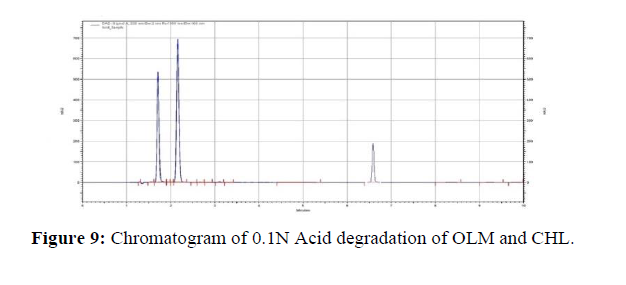
Acid Hydrolysis
For acid hydrolysis 10 ml of 0.1N HCL in 10 ml sample solution containing 20μg/ml and 12.5μg/ml of Olmesartan medoxomil and Chlorthalidone was mixed separately and was kept at 60˚C in water bath for 8hr. Then it diluted to 10 ml. Further 1ml was pipette out from both stock solutions and was diluted with diluent (50: 50, Water: ACN), Filter and injected into system and chromatogram were recorded to assess the stability of sample.
The chromatogram was represented as Figure 9.
Alkali hydrolysis
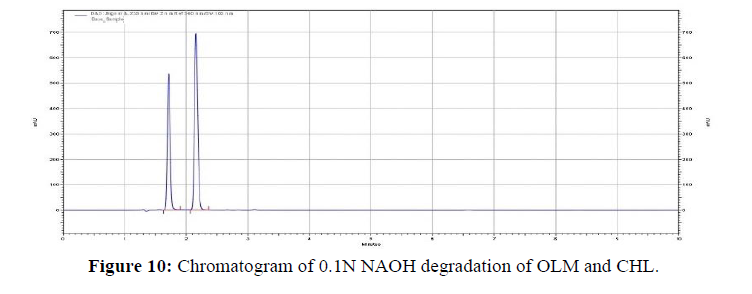
For alkali hydrolysis, 10 ml of 0.1 N NaOH was mixed to both the flask containing 10 ml sample solution of 20μg/ml and 12.5μg/ml of Olmesartan medoxomil and Chlorthalidone resp. and was kept at 60˚C in water bath for 8hr. Further 1 ml was taken from both stock solutions and was diluted with diluent (50: 50, Water: ACN), Filter and injected into system and chromatogram were recorded to assess the stability of sample. The chromatogram were represented as Figure 10.
Oxidative
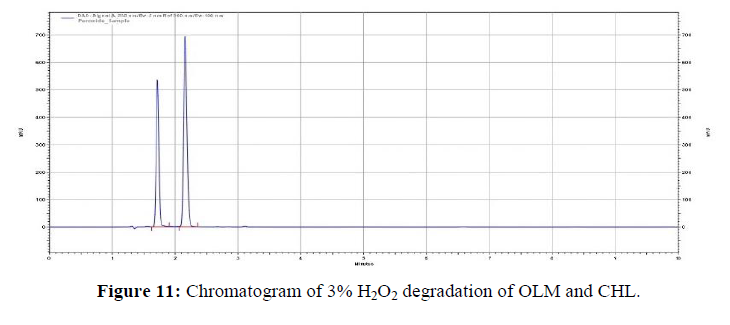
To 10 ml of 20μg/ml Olmesartan medoxomil and 12.5μg/ml Chlorthalidone containing sample solution was taken separately in 10 ml volumetric flask. 10 ml of 3% v/v H2O2 solution added to both the flask and was kept at 60˚C in water bath for 10 min. Further mixed to 10 ml. Further 1 ml was taken from both stock solutions and was diluted with diluent (50: 50, Water: ACN), Filter and injected into system and chromatogram were recorded to assess the stability of sample. The chromatogram was represented as Figure 11.
UV Analysis
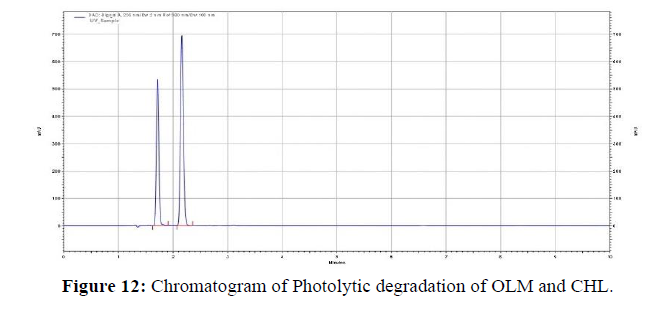
10 ml of 20μg/ml Olmesartan medoxomil and 12.5μg/ml Chlorthalidone containing sample solution was taken separately in 10 ml VF. Then it was placed in UV cabinet at 254 nm for 5 hours and later was diluted with diluent. Further 1 ml was taken from both stock solutions and was diluted with diluent (50: 50, Water: ACN), Filter and injected into system and chromatogram were recorded to assess the stability of sample. The chromatogram is represented as Figure 12.
Dry Heat
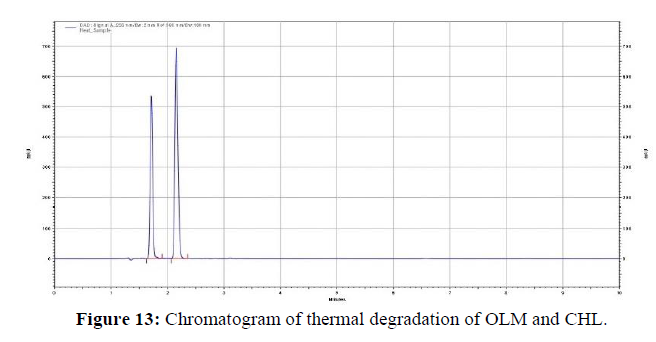
10 ml of 20μg/ml Olmesartan medoxomil and 12.5μg/ml Chlorthalidone containing sample solution was taken separately in 10 ml volumetric flask. Then it was kept in Oven at 60˚C for 2 hours and later was diluted with diluent. Further 1 ml was taken from both stock solutions and was diluted with diluent (50: 50, Water: ACN), Filter and injected into system and chromatogram were recorded to assess the stability of sample. The chromatogram is represented as Figure 13.
RESULTS & DISCUSSION
Development of Validated RP-HPLC Method for the Simultaneous Estimation of OLM and CHL in Combine Tablet Dosage Form
The separation was achieved on Phenomenex Kinetex XB-C18 (150mm x 4.6 mm, 5μ) Column using (0.1% TFA) water and Acetonitrile (55:45, v/v) as mobile phase for assay. Flow rate 1ml/min with sample size 10 μL & run time 10 minutes. Detection was carried out using UV detector at 235.0 nm. The retention time is 2.15 min. for OLM & 1.71 min. for CHL. The system suitability test shows the response with retention time, theoretical plate, tailing factor and peak area for both the drugs.
The proposed method when was applied for tablet dosage form the % label claim of OLM and CHL was found to be in limit respectively. The linearity obtained for OLM and CHL is in the range between 31.25 to 93.75 mg/mL to 50 to 150mg/mL respectively. Accuracy of the method was checked by recovery studies at three different levels i.e. 75%, 100%, 125%. The % RSD values were less than 2 indicative of accuracy of the method. The method was found to be precise as indicated by the inter-day, intra-day analysis showing the % RSD values less than 2. Data from system suitability studies indicates conformity to compendia requirements. The method was also found to be robust as indicated by % RSD values less than 2 according to ICH guidelines.
Development of stability Profile of OLM and CHL in Combine Tablet Dosage Form
For developing the stability profile the drug product is exposed to degradation medium like Acid, Alkali, Peroxide, Thermal & Photolytic. The parent drugs and degradation products formed were well resolved under optimized chromatographic conditions. The % of degradation for OLM was 17.56 % (Acid), 1.30 % (Base), 4.87% (Peroxide), 4.58% (Thermal), 3.47 %(Photolytic) While for CHL 26.15 % (Acid), 5.64 % (Base), 2.99% (Peroxide), 8.74 % (Thermal), 1.70 % (Photolytic) which is in agreement with ICH Limit. It concludes that OLM and CHL both are more labile to acid.
CONCLUSION
The developed HPLC method was found to be more accurate, precise, economic, fast, reproducible and selective for simultaneous determination of OLM and CHL in combined tablet formulation. The statistical parameter of this method showed good results. The recovery studies revealed excellent accuracy and high precision of the method. The HPLC method was found to give better results. Therefore the proposed method could be applied for routine analysis in quality control laboratories. The stability study also gave very prominent results which could be used for routine analysis.
ACKNOWLEDGEMENT
The authors of this research article are thankful to the Principal, Government College of Pharmacy, Karad for allowing us to publish this paper. We are also thankful to the AICTE for providing research fellowship to complete our research work and convert our research work into the publications.
REFERENCES
- Skoog DA, Holler FJ, Crouch SR. Principle of Instrumental analysis. 6th edition , Thomsan publications, India. 2007, p. 300.
- Skoog DA, Leary JJ. Principles of Instrumental Analysis, 4th ed. Philadelphia; Saunders College of Publishing; 1992, p. 1-2.
- Willard HH, Merritt LL, Dean JA. Instrumental Methods of Analysis, 7th ed. U.S.A; Wadsworth Publishing Company; 1986, p. 5-97.
- Khopkar SM. Basic concept of analytical chemistry, 2nd edition, New age International Ltd. Publisher, New delhi;1998.
- Mohaammad Y. J Chem Pharm Res. 2015, 7(3): p. 2440-2448.
- Sharma BK. Instrumental Methods of Chemical Analysis. 18th ed. Goel Publishing House, Meerut. 1997, p. 3-10.
- Azim Md. Sabir. Int Res J Pharm. 2013, 4(4): p. 39-46.
- Kats E. Quantitative Analysis Using Chromatographic Techniques. Wiley India pvt. Ltd. 2009, p. 193-211.
- Chatwal, GR, Anand, SK. Instrumental Methods of Chemical Analysis. 5th ed. Himalaya Publishing House, Mumbai 2002, 2: p. 149.
- Connors KA. Liquid Chromatography, A Textbook of Pharmaceutical Analysis 3rd edition, Willey Inter science, New York 1999, p. 373-438.

