Research Article - Der Pharma Chemica ( 2024) Volume 16, Issue 5
Spectroscopic Investigation and Molecular Interactions Studies on Styrene-Ethylene-Butylene-Styrene in Toluene and Tetrahydrofuran Solution in Different Concentrations at 303K by Ultrasonic Method
Subramanian Ravichandran1*, Gheetha1 and Thangavelu Krithiga22Department of Chemistry, Sathyabama Institute of Science and Technology, Chennai, India
Subramanian Ravichandran, Department of Physics, Sathyabama Institute of Science and Technology, Chennai, India, Email: drsravichandran68@gmail.com
Received: 15-Jul-2024, Manuscript No. DPC-24-141803; Editor assigned: 18-Jul-2024, Pre QC No. DPC-24-141803 (PQ); Reviewed: 01-Aug-2024, QC No. DPC-24-141803; Revised: 01-Oct-2024, Manuscript No. DPC-24-141803 (R); Published: 29-Oct-2024, DOI: 10.4172/0975- 413X.16.5.504-514
Abstract
Ultrasonic velocities and densities have been measured for the Styrene-Ethylene-Butylene–Styrene (SEBS) in Toluene and Tetrahydrofuran (THF) in different concentration at 303 K. Ultrasonic velocity has been measured using single frequency interferometer at 2 MHz (Model F-81). Adiabatic compressibility, intermolecular free length, acoustic impedance, surface tension and other acoustical parameters have been calculated to assess the SEBS-solvent interaction. It is seen that the ultrasonic velocity increases initially with the increase with concentration of SEBS and it reaches minimum value a mole fraction of 0.89527. The increase in velocity with concentrations suggests the increase in cohesive forces due to molecular interactions. The ultrasonic velocity is maximum and molecular free length is minimum at a mole fraction 1.455 of SEBS shows the closer packing molecular structure. These data are discussed with respect to the concentration of styrene-ethylene-butylene–styrene. Non-linear variations of acoustical parameters with concentrations support the strong molecular interactions. This type of molecular interaction is very important in determining the viscous flow properties of dilute polymer solutions. Computation of nonlinearity parameter (B/A) of styrene-ethylene-butylene-styrene in toluene and tetrahydrofuran solution by Hartmann and Ballou relation solution at 303 K is also carried out. The abrupt change in ultrasonic velocity of polymer solutions at a particular concentration of SEBS is primarily due to the molecular interaction between polymeric-solvent molecules. FTIR analysis is also carried out and it confirms the vibrational characteristics of the sample. Some of the absorption peaks at around 3027.42 cm-1, 2924.34 cm-1, 2862.34 cm-1 are representing C-H stretch.
Keywords
Acoustical properties; Spectroscopic; Ultrasonic velocity
Introduction
The study and analysis of intermolecular interactions plays an important role in the development of physical sciences. A large number of investigations have been made on the molecular interaction in binary liquid systems by various physical methods like infrared, Raman effect, nuclear magnetic resonance, dielectric constant, ultra violet and ultrasonic method. A number of researchers have studied acoustical properties of solutions containing ion. And it has been extensively used to determine the ion solvent interaction in aqueous solutions containing electrolytes. When an acoustical wave is passed through the binary/polymer solutions, it is affected by the molecular structure of the materials. Ultrasonic studies have found extensive applications in characterizing the aspects of thermodynamic, structural and physicochemical behavior of liquid mixtures. Ultrasonic property measurement of binary and polymer mixture has significant importance in understanding intermolecular interaction between the molecules. This ultrasonic behavior of liquid mixtures and the molecular interaction finds more application in industry and technological processes. The measurement of ultrasonic velocity and other calculated parameters has been used in understanding the nature of intermolecular interactions in binary liquid mixtures. Ultrasonic technique together with viscometric and density studies offers promising method to characterize the solutions [1-3]. Also other derived parameters from ultrasonic velocity measurements provide qualitative information about the nature and strength of molecular interactions in liquid mixtures. The committal of viscosity can useful to identify different types of fluids on the basis of molecules of liquids.
Materials and Methods
Styrene-Ethylene-Butylene-Styrene (SEBS) is used in the present study. 5 gm of styrene-ethylene-butylene-styrene were dissolved in 100 ml of Toluene and Tetrahydrofuran. The polymer solution was added with solvent in different concentration like 0:100, 10:90, 20:80, 30:70…and ultrasonic parameters were studied. The total volume of a solution should be maintained as 100 ml. For density measurements, the liquid mixtures were taken in a 10 ml gravity bottle (Borozil). The gravity bottle was dipped in a water bath. In order to obtain a constant temperature, the specific gravity bottle was kept inside the water bath for about 30 minutes. The densities of the pure liquids and liquid mixtures were measured using an electronic balance. The results of the densities are accurate to ± 0.5%. Density of the liquid mixture is calculated by using the formula ρ=(Mρw/Mw), where M is the mass of liquid mixture, ρw is density of water and Mw is the mass of water at room temperature [4,5].
Results
Acoustical properties
Ultrasonic velocities of Styrene-Ethylene-Butylene-Styrene (SEBS) in toluene and tetrahydrofuran liquid mixtures in different concentration at 303K have been determined. The measured value of ultrasonic velocity, density, viscosity and other acoustical parameters are presented in Tables 1-4 for two different systems.
| Mole fraction of SEBS (X1) | (U) m/s | (ρ) kgm-3 | (η)x 10-3 Nsm-2 | (β)x 10-10 kg-1 ms2 | (Z)x 106 kgm-2s-1 | (Lf) (10 -11 m) |
(Vf) m3mo le-1 | (πi) (N/m2) | (R) (ms-1)1/3 | (τ) 10-12 sec |
(S) 104 Nm-1 | (W) (Pa)1/7 | (RA) |
|---|---|---|---|---|---|---|---|---|---|---|---|---|---|
| 0.68462 | 1285.6 | 838.31 | 1.427 | 7.217 | 1.078 | 5.454 | 2.709 | 1.624 | 1.197 | 1.373 | 2.434 | 2.24 | 0.976 |
| 0.72741 | 1288 | 838.02 | 1.495 | 7.193 | 1.079 | 5.444 | 2.534 | 1.659 | 1.199 | 1.434 | 2.44 | 2.242 | 0.975 |
| 0.77591 | 1289.12 | 838.28 | 1.495 | 7.178 | 1.081 | 5.439 | 2.539 | 1.658 | 1.199 | 1.431 | 2.444 | 2.243 | 0.975 |
| 0.83132 | 1290.88 | 838.36 | 1.518 | 7.158 | 1.082 | 5.431 | 2.488 | 1.67 | 1.2 | 1.449 | 2.45 | 2.244 | 0.975 |
| 0.89527 | 1288.08 | 838.25 | 1.45 | 7.19 | 1.08 | 5.443 | 2.658 | 1.632 | 1.2 | 1.39 | 2.441 | 2.244 | 0.975 |
| 0.96988 | 1288.56 | 838.39 | 1.45 | 7.184 | 1.08 | 5.441 | 2.661 | 1.631 | 1.2 | 1.389 | 2.443 | 2.245 | 0.975 |
| 1.05805 | 1289.92 | 838.33 | 1.473 | 7.169 | 1.081 | 5.435 | 2.605 | 1.642 | 1.202 | 1.408 | 2.447 | 2.247 | 0.975 |
| 1.16386 | 1293.04 | 838.45 | 1.496 | 7.133 | 1.084 | 5.422 | 2.557 | 1.652 | 1.203 | 1.423 | 2.456 | 2.25 | 0.974 |
| 1.29317 | 1295.2 | 838.31 | 1.495 | 7.111 | 1.086 | 5.413 | 2.569 | 1.648 | 1.205 | 1.417 | 2.462 | 2.253 | 0.974 |
| 1.45478 | 1298.8 | 837.26 | 1.539 | 7.08 | 1.087 | 5.402 | 2.474 | 1.667 | 1.209 | 1.453 | 2.469 | 2.259 | 0.972 |
| 1.66259 | 1297.76 | 836.13 | 1.582 | 7.101 | 1.085 | 5.41 | 2.376 | 1.687 | 1.212 | 1.498 | 2.463 | 2.264 | 0.97 |
| 1.93968 | 1295.26 | 838.05 | 1.631 | 7.112 | 1.085 | 5.414 | 2.269 | 1.713 | 1.21 | 1.547 | 2.461 | 2.263 | 0.973 |
| 2.32761 | 1292.26 | 838.73 | 1.723 | 7.14 | 1.084 | 5.424 | 2.09 | 1.759 | 1.211 | 1.64 | 2.455 | 2.265 | 0.975 |
| 2.90886 | 1297.2 | 827.54 | 1.834 | 7.181 | 1.073 | 5.44 | 1.924 | 1.787 | 1.234 | 1.756 | 2.436 | 2.302 | 0.961 |
Table 1: Ultrasonic velocity (U), density (ρ) and viscosity (η), adiabatic compressibility (β), acoustic impedance (Z), intermolecular free length (Lf), free volume (Vf), internal pressure (πi) Rao’s constant/molar sound velocity (R), Relaxation time (τ), Surface tension (S), Wada’s constant (W), Relative association (Ra) of styrene-ethylene-butylene-styrene in toluene at different ratios in low concentration at 303 K.
| Mole fraction of SEBS (X1) | (U) m/s | (ρ) kgm-3 | (η)x10-3 Nsm-2 | (β)x10-10 kg-1ms2 |
(Z)x 106 kgm-2s-1 | (Lf) (10-11m) | (Vf)x10-3 m3mole-1 | (πi) (105 N/m2) | (R) (ms-1)1/3 | (τ) 10-12 sec |
(S) 104 Nm-1 | (W) (Pa)1/7 | (RA) |
|---|---|---|---|---|---|---|---|---|---|---|---|---|---|
| 2.05384 | 1299.9 | 840.28 | 1.681 | 7.043 | 1.092 | 5.387 | 2.182 | 1.738 | 1.209 | 1.579 | 2.481 | 2.261 | 0.975 |
| 2.18219 | 1302.37 | 841.12 | 1.682 | 7.009 | 1.095 | 5.374 | 2.189 | 1.736 | 1.21 | 1.572 | 2.491 | 2.263 | 0.975 |
| 2.32768 | 1297.55 | 840.02 | 1.771 | 7.071 | 1.09 | 5.398 | 2.018 | 1.781 | 1.211 | 1.67 | 2.474 | 2.265 | 0.975 |
| 2.49394 | 1297.9 | 841.91 | 1.82 | 7.051 | 1.093 | 5.39 | 1.941 | 1.806 | 1.21 | 1.711 | 2.48 | 2.263 | 0.977 |
| 2.68578 | 1301.06 | 841.99 | 1.912 | 7.016 | 1.095 | 5.377 | 1.812 | 1.846 | 1.212 | 1.789 | 2.489 | 2.267 | 0.976 |
| 2.90958 | 1300.12 | 841.29 | 1.774 | 7.032 | 1.094 | 5.383 | 2.03 | 1.775 | 1.214 | 1.663 | 2.485 | 2.271 | 0.976 |
| 3.17409 | 1294.58 | 841.18 | 1.91 | 7.093 | 1.089 | 5.407 | 1.81 | 1.842 | 1.215 | 1.806 | 2.468 | 2.273 | 0.977 |
| 3.49149 | 1298.55 | 841.21 | 2.023 | 7.05 | 1.092 | 5.39 | 1.673 | 1.889 | 1.218 | 1.902 | 2.48 | 2.279 | 0.976 |
| 3.87941 | 1293.15 | 840.56 | 2.045 | 7.114 | 1.087 | 5.415 | 1.641 | 1.897 | 1.221 | 1.94 | 2.463 | 2.283 | 0.977 |
| 4.36422 | 1293.44 | 841.01 | 2.114 | 7.107 | 1.088 | 5.412 | 1.569 | 1.922 | 1.224 | 2.003 | 2.465 | 2.289 | 0.977 |
| 4.98771 | 1294.64 | 842.22 | 2.504 | 7.084 | 1.09 | 5.403 | 1.226 | 2.084 | 1.227 | 2.365 | 2.472 | 2.296 | 0.978 |
| 5.81886 | 1298 | 837.6 | 2.875 | 7.086 | 1.087 | 5.404 | 1.008 | 2.209 | 1.241 | 2.716 | 2.468 | 2.32 | 0.972 |
| 6.98253 | 1291.1 | 837.04 | 3.439 | 7.167 | 1.08 | 5.435 | 0.773 | 2.401 | 1.249 | 3.286 | 2.446 | 2.334 | 0.973 |
| 8.72612 | 1294.56 | 836.19 | 6.328 | 7.136 | 1.082 | 5.423 | 0.316 | 3.211 | 1.264 | 6.021 | 2.454 | 2.363 | 0.971 |
Table 2: Ultrasonic velocity (U), Density (ρ) and Viscosity (η), adiabatic compressibility (β), acoustic impedance (Z), intermolecular free length (Lf), free volume (Vf), internal pressure (πi) Rao’s constant (R), Relaxation time (τ), Surface tension (S), Wada’s constant (W), Relative association (Ra) of styrene-ethylene-butylene-styrene in toluene at different ratio in high concentration at 303 K.
| Mole fraction of SEBS (X1) | (U) m/s | (ρ) kgm-3 | (η)x10-3 Nsm-2 | (β)x10-10 kg-1ms2 | (Z)x 106 kgm-2s-1 | (Lf) (10-11m) |
(Vf)x10-3 m3mole-1 | (πi) (105 N/m2) | (R) (ms-1)1/3 |
(τ) 10-12 sec |
(S) 104 Nm-1 |
(W) (Pa)1/7 | (RA) |
|---|---|---|---|---|---|---|---|---|---|---|---|---|---|
| 0.091 | 1289.8 | 861.2 | 6.8 | 6.98 | 1.111 | 5.363 | 2.348 | 966.13 | 0.067 | 6.329 | 2.513 | 0.126 | 1.002 |
| 11 | 1296.3 | 866.1 | 3.9 | 6.87 | 1.123 | 5.321 | 129.74 | 2.409 | 8.969 | 3.573 | 2.547 | 16.811 | 1.006 |
| 4.93 | 1292.3 | 867.7 | 3.4 | 6.9 | 1.121 | 5.333 | 56.77 | 5.017 | 4.508 | 3.128 | 2.54 | 8.452 | 1.009 |
| 2.88 | 1280.5 | 867.9 | 3 | 7.03 | 1.111 | 5.381 | 36.84 | 7.589 | 2.999 | 2.811 | 2.505 | 5.625 | 1.012 |
| 1.85 | 1272.9 | 869.5 | 2.4 | 7.1 | 1.107 | 5.408 | 33.15 | 9.535 | 2.241 | 2.271 | 2.488 | 4.206 | 1.016 |
| 1.24 | 1277.9 | 871.8 | 2.1 | 7.02 | 1.114 | 5.38 | 29.29 | 11.526 | 1.796 | 1.967 | 2.509 | 3.372 | 1.017 |
| 0.82 | 1281.3 | 875.3 | 1.9 | 6.96 | 1.122 | 5.355 | 25.86 | 13.638 | 1.487 | 1.763 | 2.529 | 2.792 | 1.02 |
| 0.53 | 1279.7 | 878.9 | 1.8 | 6.95 | 1.125 | 5.351 | 22.28 | 15.904 | 1.271 | 1.667 | 2.535 | 2.389 | 1.025 |
| 0.31 | 1255.8 | 879.2 | 1.6 | 7.21 | 1.104 | 5.452 | 21.18 | 17.676 | 1.106 | 1.539 | 2.465 | 2.081 | 1.032 |
| 0.14 | 1251.7 | 880.5 | 1.5 | 7.25 | 1.102 | 5.466 | 19.51 | 19.651 | 0.982 | 1.45 | 2.457 | 1.848 | 1.034 |
| 0.01 | 1250.5 | 881.4 | 1.4 | 7.26 | 1.102 | 5.468 | 25.19 | 16.867 | 1.087 | 1.354 | 2.455 | 2.045 | 1.036 |
Table 3: Ultrasonic velocity (U), Density (ρ) and Viscosity (η), adiabatic compressibility (β), acoustic impedance (Z), intermolecular free length (Lf), free volume (Vf), internal pressure (πi) Rao’s constant (R), Relaxation time (τ), Surface tension (S), Wada’s constant (W), Relative association (Ra) of styrene-ethylene-butylene-styrene in tetrahydrofuran at different ratio in low concentration at 303 K.
| Mole fraction of SEBS (X1) | (U) m/s | (ρ) kgm-3 | (η)x10-3 Nsm-2 | (β)x10-10 kg-1ms2 |
(Z)x 106 kgm-2s-1 | (Lf) (10-11m) | (Vf)x10-3 m3mole-1 | (πi) (105 N/m2) | (R) (ms-1)1/3 |
(τ) 10-12 sec |
(S) 104 Nm-1 | (W) (Pa)1/7 | (RA) |
|---|---|---|---|---|---|---|---|---|---|---|---|---|---|
| 0.21 | 1293.2 | 864.3 | 128.9 | 6.92 | 1.118 | 5.355 | 0.002 | ------ | 0.151 | 118.9 | 2.532 | 0.282 | 1.004 |
| 11 | 1288.4 | 865.8 | 29.7 | 6.96 | 1.115 | 5.363 | 6.117 | 6.666 | 8.954 | 27.553 | 2.523 | 16.786 | 1.007 |
| 4.93 | 1283.7 | 869.6 | 22.2 | 6.98 | 1.116 | 5.352 | 3.368 | 12.881 | 4.488 | 20.656 | 2.52 | 8.42 | 1.013 |
| 2.88 | 1285.7 | 870.2 | 14.9 | 6.95 | 1.119 | 5.401 | 3.349 | 16.909 | 2.995 | 13.811 | 2.527 | 5.62 | 1.013 |
| 1.85 | 1272.7 | 872.1 | 12.6 | 7.08 | 1.111 | 5.426 | 2.755 | 21.893 | 2.234 | 11.893 | 2.495 | 4.195 | 1.019 |
| 1.24 | 1266.3 | 873 | 6.9 | 7.14 | 1.105 | 5.449 | 4.852 | 21.007 | 1.788 | 6.572 | 2.478 | 3.359 | 1.022 |
| 0.82 | 1281.3 | 874.1 | 4.4 | 7.21 | 1.101 | 5.466 | 7.337 | 20.735 | 1.489 | 4.088 | 2.526 | 2.782 | 1.025 |
| 0.53 | 1273.9 | 874.3 | 2.9 | 7.25 | 1.098 | 5.475 | 10.82 | 20.163 | 1.276 | 2.725 | 2.504 | 2.387 | 1.026 |
| 0.31 | 1266.4 | 877.1 | 2.2 | 7.27 | 1.098 | 5.479 | 13.304 | 20.607 | 1.112 | 2.085 | 2.49 | 2.083 | 1.03 |
| 0.14 | 1257.4 | 878 | 1.7 | 7.28 | 1.097 | 5.339 | 16.278 | 20.834 | 0.986 | 1.633 | 2.466 | 1.852 | 1.032 |
| 0.01 | 1250.5 | 881.4 | 1.4 | 7.26 | 1.102 | 5.468 | 25.19 | 16.867 | 1.087 | 1.354 | 2.455 | 2.045 | 1.036 |
Table 4: Ultrasonic velocity (U), Density (ρ) and Viscosity (η), adiabatic compressibility (β), acoustic impedance (Z), intermolecular free length (Lf), free volume (Vf), internal pressure (πi) Rao’s constant (R), Relaxation time (τ), Surface tension (S), Wada’s constant (W), Relative association (Ra) of styrene-ethylene-butylene-styrene in tetrahydrofuran at different ratio in high concentration at 303 K.
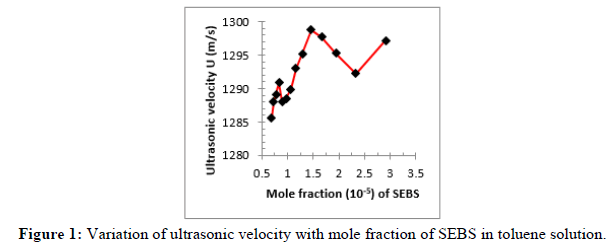
Ultrasonic velocity varies in accordance with molecular interactions in solutions. The variation of ultrasonic velocity in a solution depends upon the intermolecular Free Length (Lf). Intermolecular interaction depends on the strength of the repulsive forces acting between the solvent and solute molecules. The ultrasonic velocity increases whereas the free length decreases and vice versa. In this present investigation, a nonlinear variations of molecular free length were observed in Toluene and in THF. Lf is increases initially at low mole fraction of SEBS and it reaches minimum at a mole fraction of 1.455 in toluene. Similarly, the same nonlinear variation was observed in THF. At the particular mole fraction of SEBS, maximum force of interaction generated between the molecules and it leads to increase the cohesive energy and hence structural changes occurred. Due to the structural arrangement of molecules results in adiabatic compressibility are maximum and thereby increasing intermolecular interactions. Hence a closer packing of molecular structure formed between the solvent-solute molecules. The minimum value of ultrasonic velocity indicates weakening of the molecular association at these concentrations. The increasing the intermolecular free length shows the free space or interval between the surface of the two molecules. Therefore, it may be inferred that the sudden change in ultrasonic velocity may be due to polymer-solvent interactions. A similar report was made by Ravichandran and Ramanathan in ultrasonic velocity studies of polyacrylamide/PEG (600) and polyacrylamide/PVA blend solution at low concentrations. Also the same report produced by the Bakusele Kabane, et al., in study of intermolecular interactions in the binary mixtures of phosphonium based ionic liquid and propanoic acid [6-7].
The Figure 1 shows the graph variation of ultrasonic velocity of SEBS. The ultrasonic velocity increases with increase in mole fraction of SEBS. The variation of velocity increases as the concentration of solution increases. This supports the close packing of molecules throughout all concentrations. But a sudden decrease was observed in ultrasonic velocity at the mole fraction 0.89527 and again it is increase with mole fraction in low concentration of Toluene. Similarly, a sudden decrease in ultrasonic velocity (U) for the mole fraction 0.14, 1.24 and 1.85 and then the ultrasonic velocity increases with the increase in the mole fraction of SEBS in THF (Figures 1 and 2). Thus the graph shows the nonlinear variation of ultrasonic velocity with mole fraction of SEBS and a sudden decrease were observed at particular concentration of the two system. This is may be due to complexity formation between the constituents of mixtures and it is due to dilution of SEBS [8-10]. These observations indicate that there are weaker ion-solvent interactions in the binary solutions at a particular concentration of SEBS. This non-linear variation of velocity indicates the presence of dipole-ion interaction/specific interaction in the system [11,12].
The density decreases with increase in mole fraction of SEBS. The variations in density with increase in concentration are shown in Tables 1 and 3. But a sudden variation was observed at a mole fraction of 0.77591, 0.83132 and then the density decreases with the mole fraction of SEBS. Again there is a slight increase in density at the mole fraction of 0.96988 and 1.16386. It indicates the ion solvents interaction between the solvent-solute molecules. A large increase in density was observed at the ratio of 90:10. But above that, the increase was low, until the ratio 50:40 reached. A similar change was also observed in U at this ratio. It may be due to hydrogen bond formation. Density increases with increase in concentration of SEBS in Toluene solution due to the presence of ions or particles [12]. Viscosity of a solution is a measure of cohesiveness or rigidity present in between the ions or ion-solvent or solvent-solvent molecules present in a solution. Viscosity increases in both cases with concentration and it indicates the increase of cohesiveness present in the solute solvent molecules and it is a reflection of polymer-coiled structure due to the drive towards a minimization of the contact area of its hydrophobic segments and it increases due to electro-viscous property. The changes in viscosity imply the association or dissociation, expansion, unfolding of polymer chains [13,14].
The variation of adiabatic compressibility with the mole fraction for all the systems is shown in Figures 3 and 4. From the data, it is observed that adiabatic compressibility varies non-linearly with mole fraction of the solution (Figures 3 and 4). The adiabatic compressibility decreases with increase in mole fraction of SEBS. Decrease in adiabatic compressibility might be due to aggregation of solvent molecules around solute molecules. The divergence in compressibility can be demonstrated by considering of loss of di-polar association and difference in size and shape of liquid molecules which leads to decrease in velocity and increase in compressibility or vice versa due to dipole-dipole interaction. This indicates the existence of solute-solvent interactions [15]. It shows the strong molecular interactions between solute and solvent molecules and it can be explained in terms of the electrostatic effects of polymer on the surrounding molecules and suggests more association between solute and solvent molecules in the system,16. Increase in U and decrease in βad with concentration of SEBS indicated increased intermolecular forces forming aggregation of solvent molecules and it is affecting its structural arrangements.
Acoustic impedance is directly proportional to ultrasonic velocity and inversely proportional to adiabatic compressibility. In this study, it increases with concentration and reaches maximum value at 1.45478 mole fraction, whereas compressibility decreases. The minimum in compressibility indicates the enhancement of bond strength in a particular concentration. It shows similar behavior to that of ultrasonic velocity and opposite to that of adiabatic compressibility. A sudden decrease in acoustic impedance at mole fraction at 0.89527 and 0.96988 and then it increases with mole fraction in Toluene. Similarly, the author observed same effect, a sudden decrease observed at a mole fraction of 0.14, 0.82, 1.24 and 1.85 in THF solution. Increase in U and Z and decreases in compressibility and free length, indicates an increase in intermolecular forces with addition of SEBS in a solution (Figures 5 and 6).
The variation of molecular free length of SEBS in Toluene and THF solution is shown in Figures 7 and 8. The ultrasonic velocity increases, if intermolecular free Length (Lf) decreases. The trend of variation of Lf depends on the sizes, shape and volume of the component molecules. Initially, the intermolecular free length decreases with increase in mole fraction of SEBS in low concentration of Toluene and it reaches minimum value at a mole fraction 1.45478. It shows closer packing molecules. Molecular free length is a predominant factor in measurement of the variation of ultrasonic velocity. But a sudden increase in intermolecular free length at the mole fraction of 0.895 indicates the formation of strong hydrogen bonding between polymer and solvent molecules. Similar nonlinear variations are also observed in THF system. There is possibility of formation of complex structure between solute solvent mixtures. It is also support for the molecular interactions of the binary mixtures [15,16].
The internal pressure is a sensitive parameter to poly-solvent interactions, which reflects both the attractive and repulsive molecular interactions. The internal pressure may give the more information about the strength of forces existing between the molecules. The internal pressure decreases with increase in concentration of toluene, which indicates the decrease in cohesive forces. The reduction in internal pressure may be due to loosening of cohesive forces leading to breaking the structure of the solute. Due to weakening of intermolecular forces of attraction the internal pressure should fall. A slight decrease in internal pressure was observed at the mole fraction 0.77591, 0.96988 and 1.29317 in the liquid mixtures. A sudden decrease of internal pressure at the mole fraction of 0.89527 and the increase of internal pressure with concentration also confirms the interaction between the solute-solvent molecules in toluene mixtures [17,18]. And the same effect is observed in THF solution. Rao’s constant was measured for the mixture of SEBS in different concentrations and given in Tables 2-4 (Figure 9).
The Rao’s constant increases with increase in mole fraction of SEBS, indicates that the magnitude of interactions is enhanced. This increasing trend of Rao’s constant indicates that availability of more number of components in a given region of space. This leads to tight packing of the medium and thereby increases the interactions. In this present work, the data shows the nonlinear variations of Rao’s constant with increase in mole fraction of SEBS and it is also support the molecular interactions [19].
Viscous relaxation time is the time taken for the excitation energy to appear as translational energy. The variations in specific relaxation time are mainly due to the change in viscosity of solutions due to the concentration. The non-linear variation of relaxation time with increase in molar concentration is due to the existence of significant molecular interaction between the solute and solvent molecules. The relaxation time increases with increase in mole fraction of SEBS. It is observed that slight decrease in relaxation time at the mole fraction of 0.77591, 0.89527 and 1.29317 in toluene solution. Similarly, a sudden decrease in relaxation time at the mole fraction 0.14 and then it is increases with the increase in the mole fraction of SEBS in THF solution system. This is also gives the support for the molecular interactions,19. Surface tension shows the attractive interactions between the toluene and THF solutions. It increases with mole fraction of SEBS. The graph shows the nonlinear increase of Surface tension with increase in mole fraction of SEBS. Similarly, a sudden decrease in surface tension at the mole fraction 0.14, 0.82, 1.24, 1.85 and then the surface tension increases with the increase in the mole fraction of SEBS (Figures 10 and 11) [20].
Fourier- transforms-infrared spectroscopy analysis
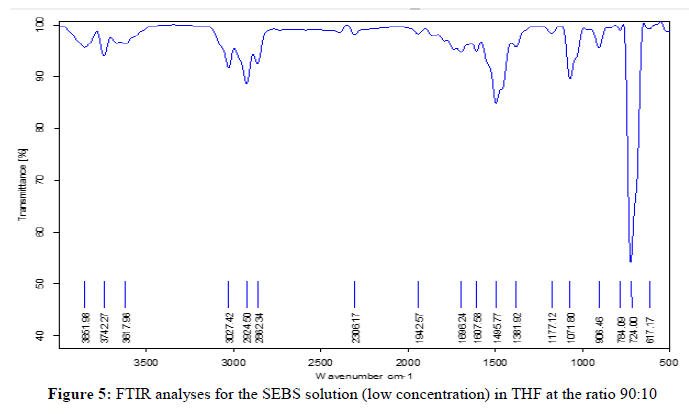
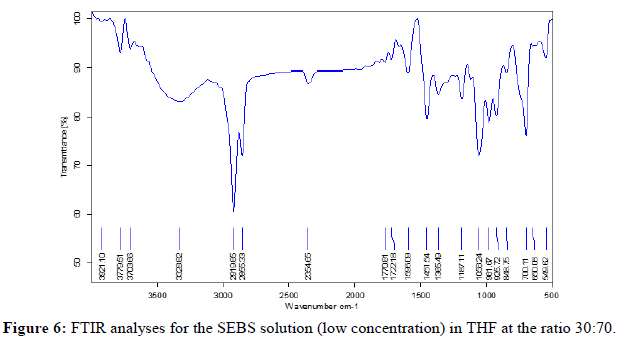
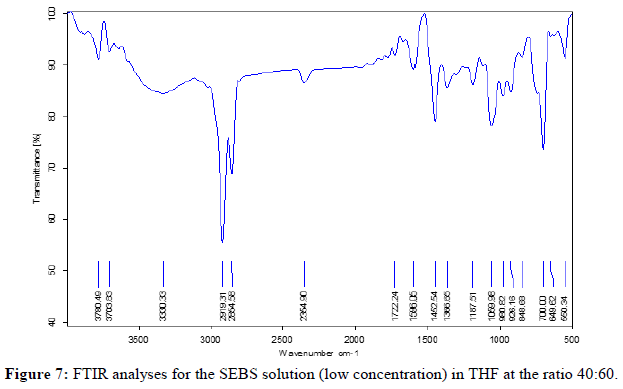
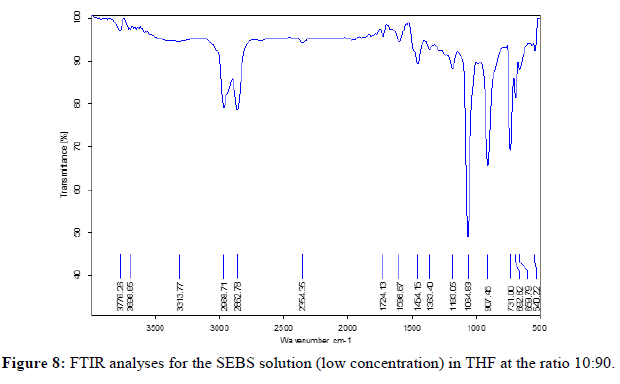
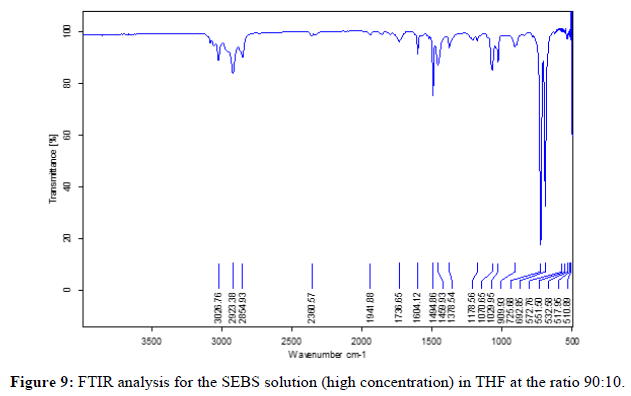
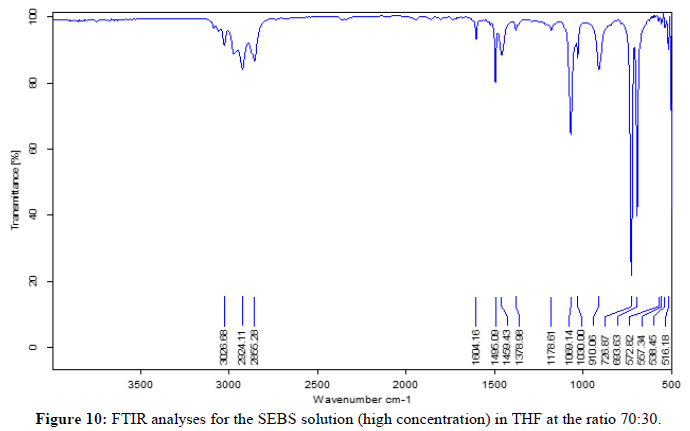
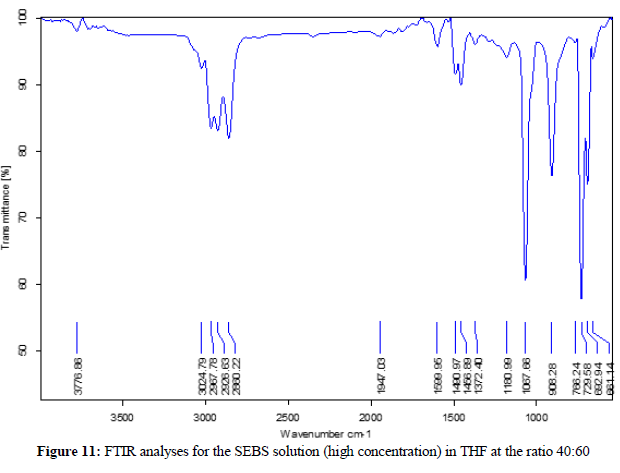
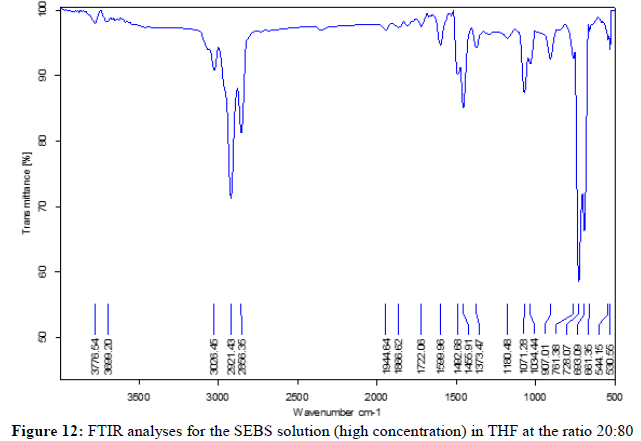
Now days, more research scholar reported characteristics of nano fluids by FTIR spectroscopy. The FTIR spectra of styrene-ethylene-butylene-styrene in tetrahydrofuran solution in different concentrations at 303 K. FTIR spectral studies allowing some important conclusions to be drawn about the possible molecular interactions between the constituent polymer mixtures. In the IR spectra of polymer solution, there are many spectra bands were observed more than one observing group. Some of the absorption peak at around 3027.42 cm-1, 2924.34 cm-1, 2862.34 cm-1, are representing C-H stretch; 1696.24 cm-1, 1770.81 cm-1, 1722.18 cm-1, 1722.24, 1724.13 cm-1 are shows the C=O stretch bands, 906.46 cm-1, 784.09 cm-1, 724.00 cm-1, 617.17, 848.75, 981.67 cm-1 are shows the C-H bend,1607.58 cm-1, 1770.81 cm-1, 1722.18 cm-1 indicates the C=O stretch were observed in lower concentration. Similarly, 2854.93 cm-1,1178.56 cm-1,1029.95 cm-1,1030.00 cm-1,1067.66 cm-1 peaks are observed at higher concentrations. Some of the peaks were shifted due to interactions between the SEBS with solvent. C-H bend, C=C stretch aromatic, C-H stretch, C-O alkyl are present in all composition of polymer mixtures and C-O acyl is also present in the solution. These data showed some chemical reaction in the mixture (Figure 12).
Discussion
The type of molecular interactions can be measured by ultrasonic velocity, density, viscosity and pressure measurements for different mole fraction of SEBS in Toluene and in Tetrahydrofuran solution at room temperature. By using above measured data, other acoustical parameters like adiabatic compressibility, acoustic impedance, intermolecular free length, Rao constant, relaxation time, surface tension, Wada’s constant and relative association are calculated for these two binary system at different concentration. In this investigation, a non-linear variation of ultrasonic velocity was observed in Toluene and Tetrahydrofuran solution due to the dilution of SEBS. The increase in U for the addition of 10 ma of THF is due to enhanced solution of SEBS by THF. But the decrease in U, by the addition of 20, 30, 40 ml is due to dilution. In otherward, there is no much solute-solvent interaction. Unexpectedly, ultrasonic velocity increase at 50:50 and 40:30, it reveals that, in this ratios of mixtures, the solvent is much solvation of solute by solvent. This could be possible, if SEBS dissolves completely in THF and organizes to form a matrix that entraps the solvents. Above 40:50 concentrations, the velocity gradually decreases. Hence the solvents must be free and the excess solvent must be free and not involved in the solvation of SEBS. Ultrasonic velocity of a binary solution depends on intermolecular free length. When ultrasonic wave passed through a solution, the molecules gets agitated and again its comeback to the equilibrium position due to its elastic behavior of a medium. When a mole fraction of SEBS is increased, to solvent, its molecules attract certain solvent molecules towards them, known as compressibility. At a particular higher concentration, solvent-solute molecules are aggregated due to the supports of molecular interaction force. And hence, the structure of the solute is reformed. Decrease of Lf with higher concentration supports the molecular interactions (Tables 5-8).
| Mole fraction of SEBS (X1) | Experimental velocity (U) m/s | (B/A) Nonlinear parameter calculated by Hartmann and Balizer method | (B/A) Nonlinear parameter calculated by Ballou empirical relation |
|---|---|---|---|
| 0.68462 | 1285.6 | 9.623 | 8.834 |
| 0.72741 | 1288 | 9.609 | 8.817 |
| 0.77591 | 1289.12 | 9.602 | 8.809 |
| 0.83132 | 1290.88 | 9.592 | 8.796 |
| 0.89527 | 1288.08 | 9.608 | 8.816 |
| 0.96988 | 1288.56 | 9.605 | 8.813 |
| 1.05805 | 1289.92 | 9.597 | 8.803 |
| 1.16386 | 1293.04 | 9.579 | 8.78 |
| 1.29317 | 1295.2 | 9.566 | 8.765 |
| 1.45478 | 1298.8 | 9.545 | 8.739 |
| 1.66259 | 1297.76 | 9.551 | 8.747 |
| 1.93968 | 1295.26 | 9.566 | 8.765 |
| 2.32761 | 1292.26 | 9.584 | 8.786 |
| 2.90886 | 1297.2 | 9.555 | 8.751 |
Table 5: Computation of non-linearity (B/A) parameter of styrene-ethylene-butylene-styrene in toluene at different ratio in low concentration solution at 303 K.
| Mole fraction of SEBS (X1) | Experimental velocity (U) m/s | (B/A) Nonlinear parameter calculated by Hartmann and Balizer method | (B/A) Nonlinear parameter calculated by (U) m/s Ballou empirical relation |
|---|---|---|---|
| 2.05384 | 1299.9 | 9.539 | 8.731 |
| 2.18219 | 1302.37 | 9.525 | 8.714 |
| 2.32768 | 1297.55 | 9.553 | 8.748 |
| 2.49394 | 1297.9 | 9.551 | 8.746 |
| 2.68578 | 1301.06 | 9.532 | 8.723 |
| 2.90958 | 1300.12 | 9.538 | 8.729 |
| 3.17409 | 1294.58 | 9.57 | 8.769 |
| 3.49149 | 1298.55 | 9.547 | 8.741 |
| 3.87941 | 1293.15 | 9.578 | 8.779 |
| 4.36422 | 1293.44 | 9.577 | 8.777 |
| 4.98771 | 1294.64 | 9.569 | 8.769 |
| 5.81886 | 1298 | 9.55 | 8.745 |
| 6.98253 | 1291.1 | 9.59 | 8.794 |
| 8.72612 | 1294.56 | 9.57 | 8.769 |
Table 6: Computation of non-linearity (B/A) parameter of styrene-ethylene-butylene-styrene in toluene at different ratio in high concentration solution at 303K.
| Mole fraction of SEBS (X1) | Experimental velocity (U)m/s | (B/A) nonlinear parameter calculated by Hartmann and Balizer method | (B/A) nonlinear parameter calculated by Ballou empirical relation |
|---|---|---|---|
| 11 | 1289.8 | 9.598 | 8.804 |
| 4.93 | 1296.3 | 9.559 | 8.757 |
| 2.88 | 1292.3 | 9.583 | 8.786 |
| 1.85 | 1280.5 | 9.653 | 8.871 |
| 1.24 | 1272.9 | 9.699 | 8.927 |
| 0.82 | 1277.9 | 9.669 | 8.89 |
| 0.53 | 1281.3 | 9.648 | 8.865 |
| 0.31 | 1279.7 | 9.658 | 8.877 |
| 0.14 | 1255.8 | 9.804 | 9.056 |
| 0.01 | 1251.7 | 9.829 | 9.087 |
Table 7: Computation of non-linearity (B/A) parameter of of styrene-ethylene-butylene-styrene in in Tetrahydrofuran at different ratio in low concentration solution at 303 K.
| Mole fraction of SEBS (X1) | Experimental velocity (U) m/s |
(B/A) Nonlinear parameter calculated by Hartmann and Balizer method | (B/A) Nonlinear parameter calculated by Ballou empirical relation |
|---|---|---|---|
| 11.00 | 1293.2 | 9.578 | 8.779 |
| 04.93 | 1288.4 | 9.606 | 8.813 |
| 02.88 | 1283.7 | 9.634 | 8.847 |
| 01.85 | 1285.7 | 9.622 | 8.833 |
| 01.24 | 1272.7 | 9.700 | 8.928 |
| 00.82 | 1266.3 | 9.739 | 8.976 |
| 00.53 | 1281.3 | 9.648 | 8.865 |
| 00.31 | 1273.9 | 9.693 | 8.919 |
| 00.14 | 1266.4 | 9.738 | 8.975 |
| 00.01 | 1257.4 | 9.794 | 9.043 |
Table 8: Computation of non-linearity (B/A) parameter of styrene-ethylene-butylene-styrene in in tetrahydrofuran at different ratio in high concentration solution at 303K.
Further a closer packing molecular structure observed at higher concentration indicating a strong interaction at these concentrations. Generally, internal pressure increases with increase in intermolecular attraction. A pure solvent shows higher value of intermolecular free length than all other concentrations because its adiabatic compressibility is increases. Compressibility is low at some concentrations since solvent is associated with SEBS. But at the concentration of 50:50, it decreases. Hence solvents must be used for solvation that reduced compressibility. In this present investigation, internal pressure increases with mole fraction indicating the strength of interaction increases with SEBS in toluene/tetrahydrofuran at lower concentration. But at higher concentration, a sudden decrease of internal pressure was observed indicating the dipole-dipole interactions are strong. The linear variation in the Rao constant value with mole fraction of SEBS suggests that interactions are depends on the concentration of a mixture and this increase value of “R” indicating the dipole-induced dipole attraction. The variation of ultrasonic behaviors of SEBS in two systems suggests that these are strong polymer-solvent interactions of higher concentrations. The observed linear relationship between acoustic impedance and the ultrasonic velocity indicates the strong solute-solvent interactions may be due dipole-dipole or Hydrogen bonding interactions.
Conclusion
In this study, the measurement of ultrasonic velocity and acoustical parameters of styrene-ethylene-butylene-styrene in toluene and tetrahydrofuran solution in different concentration at 303 K were carried out. The concentration and nature of solvent, solute and composition of a solution plays an important role in determining the interactions between solvent and solute. These acoustical studies will be reveals SEBS exhibits the unique behavior at the ratio 70:30, 60:40 and 50:50. The Lf for stock solution is higher than 90:10. Hence at 90:10 concentrations, sudden molecules must be used to solvate SEBS. The increase in Lf is due to presence of free solvents. But the decrease due to strong association with SEBS. On the basis of the measurement of nonlinear parameter, it can be concluded that the variation of computed values of B/A will depends on the ultrasonic sound wave in a given medium which helps in the interpretation of the magnitude of the hardness of the liquid in terms of the non-linearity parameter. The adiabatic compressibility suggests that the lack of interaction between unlike molecules that have the minimum declarations. So, solvents must be used for solvation and hence reduced compressibility. Hydrogen bonding interactions have investigated between non polar solvent and polymeric groups in the SEBS-Toluene solution at different concentrations. So this study will be reveals SEBS exhibits the unique behavior at the ratio 70:30, 60:40 and 50:50. An FTIR report of the SEBS solution indicates the functional groups that will support the interactions in mixtures. This investigation is useful to understand the molecular interactions in the SEBS in Toluene and THF mixtures in different concentrations at 303 K.
References
- Weiss RA, Sen A, Willis CL, Pottick LA. Polymer. 1991; 32(10): p. 1867-1874.
- Müller F, Ferreira CA, Franco L, et al. J Phys Chem B. 2012; 116(38): p. 11767-11779.
- Wang Q, Lu Y, Li N. Desalination. 2016; 390: p. 33-46.
- Ribeiro S, Costa P, Ribeiro C, et al. Compo Part B: Eng. 2014; 67: p. 30-38.
- Polat K, Şen M. J Poly Eng. 2014; 34(9): p. 787-792.
- Lee JC, Park KL, Bae SM, et al. Macromolecules. 2020; 53(17): p. 7274-784.
- MG A, Chatterjee T, Naskar K. J Appl Polym Sci. 2020; 137(48): p. 49598.
- Harlay A, Brossier T, Morand N, et al. Poly Eng Sci. 2021; 61(12): p. 3082-3093.
- Gupta G, Scott K, Mamlouk M. Fuel Cells. 2018; 18(2): p. 137-147.
- Zhang S, Zhu X, Jin C, et al. React Funct Polym. 2019; 138: p. 62-69.
- Tian H, Wang Y, Wu C, et al. Macromolecules. 2024; 57(13): p. 6275-6283.
- Nishida M, Eisenberg A. Macromolecules. 1996; 29(5): 1507-1515.
- Tian D, Park S, Jo S, et al. ACS Appl Energy Mater. 2024; 7(15): p. 6209-6219.
- Ruiz‐Colón E, Pérez‐Pérez M, Suleiman D. J Polym Sci Part A: Polym Chem. 2018; 56(13): p. 1424-1435.
- Youngblood JP, Andruzzi L, Ober CK, et al. Biofouling. 2003; 19(S1): p. 91-98.
[Crossref] [Google Scholar] [PubMed]
- Lu X, Isacsson U. J Appl Polym Sci. 2000; 76(12): p. 1811-1824.
- Pless CJ, Nikzad S, Papiano I, et al. Adv Electron Mater. 2023; 9(5): p. 2201173.
- Cho KY, Hwang SS, Yoon HG, Baek KY. J Polym Sci Part A: Polym Chem. 2013; 51(9): p. 1924-1932.
- Li J, Jiao L, Xiao X, et al. Electroanalysis. 2022; 34(11): p. 1763-1771.
- Godoy AP, Amurim LG, Mendes A, et al. Prog Org Coat. 2021; 158: p. 106341.

