Research Article - Der Pharma Chemica ( 2018) Volume 10, Issue 5
Spectrophotometric Determination of Verapamil Hydrochloride using Bromokresol Green
Marta Sulyma*
Danylo Halytsky Lviv National Medical University, Pekarska 69, Lviv, 79010, Ukraine
- *Corresponding Author:
- Marta Sulyma
Danylo Halytsky Lviv National Medical University
Pekarska 69, Lviv, 79010, Ukraine
Abstract
Simple, accurate, and precise spectrophotometric method has been developed and validated for the estimation of verapamil hydrochloride in tablets. The method is based on the condensation of verapamil hydrochloride with bromokresol green (BKG) in an acetone medium. The spectrophotometric method based on the measurement of the colored product at 409 nm. The reaction conditions were studied and optimized. Beer’s law was obeyed in the concentration range of 1.9648-4.4208 mg 100 ml-1 with RSD of 8.74 x 10⁻² and 3.33 x 10⁻² and molar absorptivity of 9.94 x 10³, the range of application of the methods is 65-135% of the nominal content of verapamil hydrochloride in the dosage forms.
Keywords
Verapamil hydrochloride, Bromokresol green, Spectrophotometric assay
Introduction
Verapamil is the prototypical blocker of L-type calcium channels that produces excitation-contraction uncoupling in cardiac muscle by preventing the slow-inward current of calcium ions. Verapamil hydrochloride (RS) -5- [(3,4-Dimethoxy-phenethyl)methyl-amino] -2- (3,4- dimethoxy-phenyl) -2-isopropyl-valeronitrile mono-hydrochloride. The literature highlights a number of methods for quantifying verapamil hydrochloride, both in pure form and in the dosage forms, among them spectrophotometric [1-6] and chromatographic [7,8] methods are presented. Among the spectrophotometric methods, the extractive methods dominate with using of a variety of color reagents.
So, M. Salh [5] in his work describes the method of verapamil hydrochloride determination, which is based on the formation of a colored complex with bromotymol blue and subsequent extraction of the formed complex with chloroform. The optical density of the extracted complex is measured at 420 nm. Despite a number of advantages, the described methods also have some disadvantages, such as the use of expensive equipment in the case of chromatography, as well as the use of toxic reagents, along with the longtime of assay in the case of extractive spectrophotometry.
Therefore, the aim of presented study was to develop a highly sensitive, easy-to-use and economical method for quantitative determination of verapamil hydrochloride in the dosage forms based on the reaction with BKG, as well as validation of the developed methodology.
Experimental Section
The materials and methods of research
The objects of the study were the Verapamil-Darnitsa tablets in the dosage of 80 mg (Private joint-stock company pharmaceutical firm Darnitsa (Kyiv, Ukraine, series BT 10217)), in addition the Verapamil-Darnitsa tablets in the dosage of 40 mg (Private joint-stock company pharmaceutical firm Darnitsa (Kyiv, Ukraine, series BU 10217)).
Chemicals and reagents
All reagents that were used were of analytical grade: Verapamil hydrochloride (Recordati Industria Chiniare Farmaceutica, Sp. A, Italy, series 16100797), bromokresol green, acetone. All solvents and other chemicals that were used throughout this study were of analytical grade.
Apparatus Spectrophotometer Specord 200, electronic scales ABT-120-5 DM, ultrasound bath ELMASONICE 60 H were used for all measurements.
Procedure for the assay of verapamil hydrochloride
Verapamil hydrochloride 0.03 g was dissolved in acetone and the total volume was made up to 100 ml with acetone, mixed well. Aliquots of verapamil hydrochloride (0.1965-0.4421 mg) were pipetted into a series of test tubes. To each test tube 1.00 ml of 1.5% bromkresol green solution in acetone were added, mixed well and the volume was made up to the mark with acetone. The absorbance was measured at 409 nm against a reagent blank treated similarly after 5 min.
Procedure for the assay of verapamil hydrochloride in pharmaceutical preparations
Twenty tablets of Verapamil-Darnitsa, 80 mg and the tablets Verapamil-Darnitsa, 40 mg were accurately weighed and powdered. A portions of powder (equivalent to 0.1000 g of Verapamil-Darnitsa, 80 mg and 0.1000 g Verapamil-Darnitsa, 40 mg were dissolved in acetone, and diluted to 100 ml with acetone, mixed in an ultrasonic bath for 1 min and filtered. To 1.00 ml of filtrate in 10 ml volumetric flask 1.00 ml of BKG solution were added, mixed well and the volume was made up to the mark with acetone. The absorbance was measured at 409 nm against a reagent blank treated similarly after 5 min. The concentration of verapamil hydrochloride was calculated from calibration curve.
Results and Discussion
At the development of the method for quantitative determination of verapamil hydrochloride, which is based on the condensation of verapamil hydrochloride with BKG, the following factors were studied: the nature and composition of the solvent, the quantity of the reagent, the reaction rate and the time-dependent stability of the analyzed solutions.
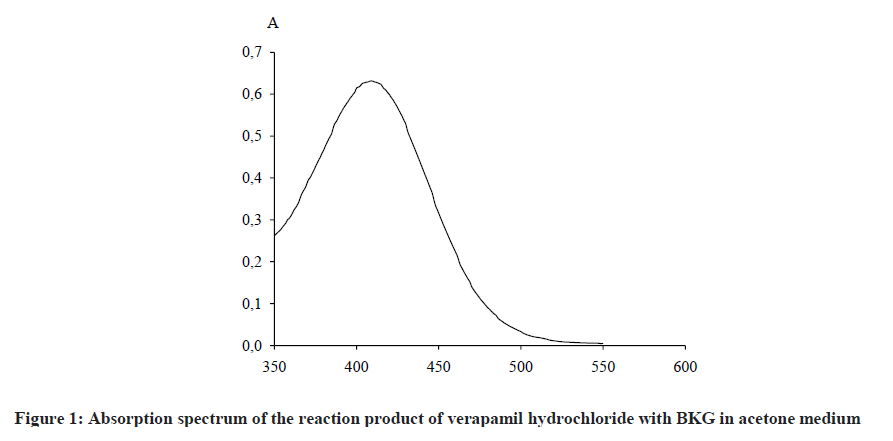
The solvent was chosen bearing in mind the solubility of verapamil hydrochloride and BKG, as well as the maximum yield of the reaction product, i. e., the maximum value of optical density. The amount of reagent was also selected at the maximum value of the optical density. It was established experimentally that the reaction proceeds in acetone medium at room temperature using 1.5% BKG as a color reagent to form a colored reaction product with a maximum absorption at 409 nm (Figure 1).
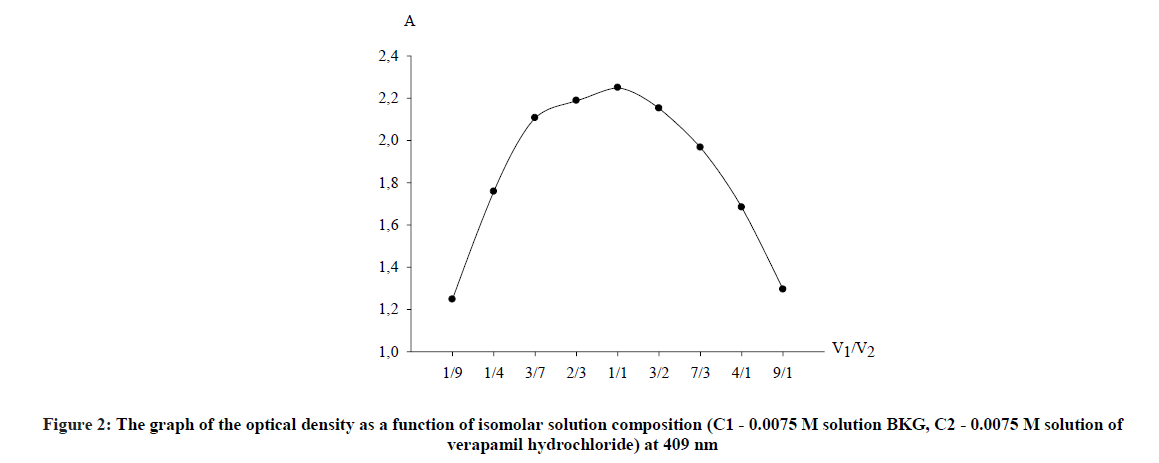
For this purpose, the measurement of the optical density of colored solutions for an hour with an interval of 5 min was performed. It was found that the analyzed solutions stabilized after 5 min and remain stable for at least 45 min. The stoichiometric coefficients between verapamil and BKG were determined by the method of continuous changes (the method of isomolar series) and by the saturation method (the molar ratio method) [9]. The method of isomolar series is based on the determination of the ratio of isomolar concentrations of the reactants, which corresponds to the maximum yield of the compounds formed as a result of the reaction. To perform the analysis, solutions of the reagent and tested drug of equal molar concentration (0.0075 M) were prepared and mixed in antibate ratios, while the total volume of the solution remained constant.
The reaction was carried out according to the developed method. According to the obtained data, a plot of the dependence of the optical density on the ratio of volumes of components of isomolar series (Figure 2).
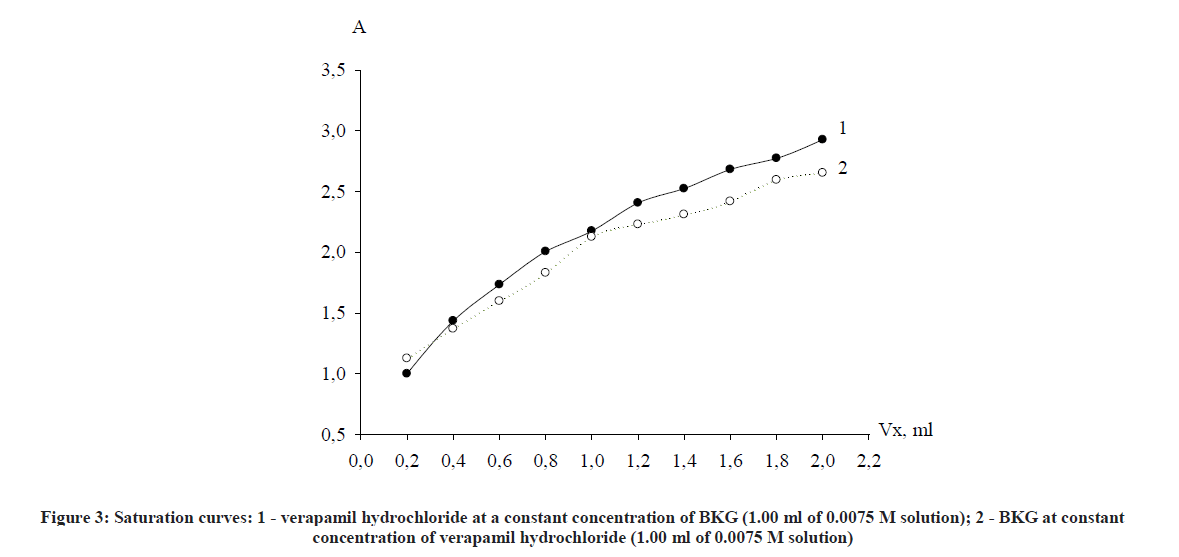
The molar correlation method establishes the dependence of the optical density on the concentration of one of the components of the reaction mixture at a constant concentration of the second component and vice versa. The point of bend on the saturation curve is equal to the stoichiometric coefficient of the component whose concentration has changed (Figure 3).
As clearly seen from the curve, stoichiometric ratios of reacting components verapamil - BKG, obtained by both methods correspond with each other and are in a ratio of 1: 1. It was concluded from Figures 2 and 3 that the reaction proceeds in a molar ratio of 1:1.
Validation of the proposed methods
According to the requirements of the State Pharmacopoeia of Ukraine, methods for quantitative determination of medicinal products should be validated [10].
Overall uncertainty
The predicted total uncertainty of the results of the analysis should not exceed the maximum permissible uncertainty of the results of the analysis max ΔAs. The total predicted relative uncertainty was calculated by using the following equation:

Where ΔSP - uncertainty of given sample of the tested substance; ΔFAO - uncertainty of the final analytical operation.
In the case of spectrophotometric analysis, the uncertainty of the final analytical operation is 0.70% (Table 1).
| Phase of the sample preparation | Parameter | Uncertainty, % |
|---|---|---|
| Stock standard solution | ||
| 1) weighing of exact mass of verapamil hydrochloride | m0 | 0.2 mg/30 mg x 100% = 0.67% |
| 2) dilution to 100 ml in a volumetric flask | 100 | 0.12 % |
| 3) pipetted of aliquot (1.00 ml) | 1 | 0.6% |
| 4) dilution to 10 ml in a volumetric flask | 10 | 0.5% |
| Tested solution | ||
| 5) weighing of exact mass of tablets powder | m1 | 0.2 mg/100 mg x 100% = 0.2% |
| 6) dilution to 100 ml in a volumetric flask | 100 | 0.12% |
| 7) pipetted of aliquot (1.00 ml) | 1 | 0.6% |
| 8) dilution to 10 ml in a volumetric flask | 10 | 0.5% |
Table 1: Calculation of the uncertainty of sample preparation (tablets Verapamil-Darnitsa)

Complete uncertainty of the analytical method:

In order to control the quality of the final medicinal products, quantitative determination methods allowed to be used just after confirmation that given medicinal product does not lead to an unacceptable deterioration of the metrological characteristics of the method. Therefore, the developed methods for the determination of verapamil hydrochloride as a part of the dosage forms were validated with the following validation characteristics as linearity and sensitivity, precision, correctness, robustness [10].
Linearity and sensitivity
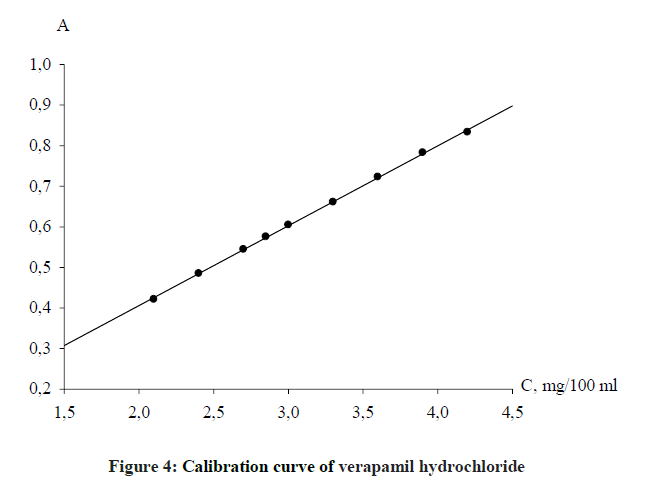
The determination of the linearity was carried at the concentrations range according to the main law of light absorption, namely 1.9648-4.4208 mg 100 ml-1. Standard solution of verapamil hydrochloride was diluted for obtaining the solutions with 0.03% concentration, which were analyzed according to the general procedure. The dependence of the optical density on the concentration of the analyzed solution is described in Figure 4.
The parameters of linearity were calculated by a regression analysis using the least squares method. The obtained values: Slope, b ± (Sb), Intercept, a ± (Sa), Standard error of estimate, Sx,o and Correlation coefficient (r) are summarized in Table 2.
| Molar absorptivity, ε | 9938 9.94 x 10³ |
| Sandell's sensitivity, WS | 0.0494 |
| Limit of detection, Cmin (μg/ml) | 2.47 |
| Linear regression equation | Y = bX + a |
| Slope, b ± (Sb) | 0.1969 ± (0.0017) |
| Intercept, a ± (Sa) | 0.0121 ± (0.0055) |
| Standard error of estimate, Sx,o | 0.0034 |
| Correlation coefficient (r) | 0.9997 |
Table 2: Spectrophotometric characteristics and statistical data of the regression equations
The linearity of the technique is confirmed throughout the concentration range indicated above (Table 2). Thus, the concentration range of application of the technique is 65-135% of the nominal content of verapamil hydrochloride in the drug.
Precision
The precision of the method was estimated by measuring nine replicate samples of verapamil hydrochloride. The assays gave satisfactory results; the one-way confidence interval Δx does not exceed the maximum permitted uncertainty of the analysis, so the technique is accurate at the level of convergence (Table 3). This level of precision of the proposed method was adequate for the quality control analysis of verapamil hydrochloride in its pharmaceutical dosage forms.
| Formulation names | ͞x (n=9) | S | RSD% | Δx |
|---|---|---|---|---|
| Verapamil-Darnitsa - 80 mg | 8.09 x 10⁻² | 7.07 x 10⁻⁵ | 8.74 x 10⁻² | 1.31 x 10⁻⁵ |
| Verapamil-Darnitsa - 40 mg | 3.99 x 10⁻² | 1.33 x 10⁻⁴ | 3.33 x 10⁻² | 2.47 x 10⁻⁴ |
Table 3: Evaluation of the accuracy and precision of the proposed procedure
Correctness
The correctness of the procedure was determined by the method of additives. Different amounts of verapamil hydrochloride solution were added to three equal samples of the dosage form and analyzed three times. The calculated criteria of practical insignificance for both dosage forms do not exceed the maximum permissible uncertainty of the analysis (Table 4).
| Formulation names | ͞z (n=9) | S | ΔZ | ͞z − 100 |
|---|---|---|---|---|
| Verapamil-Darnitsa - 80 mg | 99.36 | 0.123 | 0.227 | 0.64 |
| Verapamil-Darnitsa - 40 mg | 99.89 | 0.457 | 0.850 | 0.11 |
Table 4: Correctness of the results of quantitative determination of verapamil hydrochloride
Robustness
The assessment of robustness was carried out at the stage of development of the methodology. The impact of external factors that may affect the optical density: the time-dependent stability of the analyzed solutions and the amount of reagents added. It has been found that the tablets solutions are stable for at least 45 minutes and the variation in the amount of added reagents within ± 10% does not significantly affect the optical density.
Conclusion
Validated spectrophotometric method for verapamil hydrochloride assay in tablets has been elaborated. The method is simple, precise, accurate, and reliable for the determination of verapamil hydrochloride in tablets without interference from the common excipients. It was proved by validation characteristics (linearity, precision, correctness, and robustness) that the developed methodology is correct.
References
- K. Sayanna, Int. J. Modern Engg. Res., 2013, 3(5), 3079-3085.
- M.A. Omar, O.H. Abdelmageed, A.A. Abdelgaber, S.F. Saleh, NaturalScience., 2013, 5(4), 514-525.
- N. Rahman, N. Ahmadkhan, S.N.H. Azmi, ScienceAsia., 2005, 31, 341-348.
- N. Rahman, M.N. Hoda, Anal. Bioanal. Chem., 2002, 374(3), 484-489.
- D.M. Salh, Int. J. Chem. Environ. Engg., 2012, 3(2), 15-20.
- D.M. Salh, IHJPAS., 2010, 23(3).
- S.M. Johnson, S.K. Wahba Khalil, J. Liq. Chromatogr., 2006, 1187-1201.
- Y. Ozkan, N. Yilmaz, S.A. Ozkan, I. Biryol, Farmaco., 2000, 55(5), 376-382.
- M.I. Bulatov, I.P. Kalinin, Practikal guide for photocolorimetrical methods of analysis (Prakticheskoe rukovodstvo po photometricheskim metodsm analiza), 5th (Edn.), Chimia Leningrad, 1986.
- State Pharmacopea of Ukraine, 1st (Edn.), Naukovo-expertnyy centr, 2008.


