Research Article - Der Pharma Chemica ( 2019) Volume 11, Issue 1
Reversed Phase-UPLC Separation Analysis of Amitriptyline and Pregabalin from Their Degradants
Srikanth Kanithi and Naga Sesha Sai Pavan Kumar Chebolu*Naga Sesha Sai Pavan Kumar Chebolu, Department of Sciences and Humanities, Chemistry Division, Vignan’s Foundation for Science, Technology & Research, Vadlamudi, Guntur, Andhra Pradesh-522 213, India, Email: registrar@vignanuniversity.org
Abstract
A simple, expeditious, and explicit stability-indicating Ultra Performance Liquid Chromatography (UPLC) analytical method was developed and validated for the quantitative analysis of Amitriptyline and Pregabalin in bulk drugs and combined dosage formulations. The method was validated by using Acquity UPLC HSS C18 (100 mm × 1.8 μ) column, the column temperature was maintained at 25°C and the run time 3 min. The mobile phase was a mixture of Mobile Phase: A–Acetonitrile, B–0.1% Ortho Phosphoric acid in water, injection volume of samples was 1 μl and the UV detection λmax at 256 nm. The retention times were discerned as 1.76, 2.11 min and the linearity range was covered from 2.5 μg/ml to 15 μg/ml, 18.75 μg/ml to 112.5 μg/ml of Amitriptyline and Pregabalin respectively. The validation of the method established as per ICH guide lines and the method proved that separation of different degradation products along with the pure drugs were found to be capable of giving swift retention times with fine resolution than that achieved with conventional UPLC. This method exhibited an excellent performance in terms of sensitivity and swift and the results of stress testing was undertaken according to the ICH guidelines reveal that the method is specific and stable and the method has the ability to separate these drugs individually and from their degradation products in solid dosage forms and hence this method can be used for routine analysis in quality control.
Keywords
Stability indicating assay, RP-UPLC, Amitriptyline, Pregabalin, Forced degradation studies
Introduction
Amitriptyline
Amitriptyline with chemical name, 3-(10,11-dihydro-5H-dibenzo[a,d]cycloheptene-5-ylidene)-N,N-dimethylpropan-1-amine (Figure 1) is a tricyclic antidepressant, and is a derivative of dibenzocyclo heptadiene and a tricyclic antidepressant. Amitriptyline restrain the re-uptake of norepinephrine and serotonin by the presynaptic neuronal membrane in the Central Nervous System (CNS), thereby increasing the synaptic concentration of norepinephrine and serotonin. Due to constant stimulation to these receptors, amitriptyline may produce a down regulation of adrenergic and serotonin receptors, which may contribute to the antidepressant activity. Amitriptyline is used to treat a number of medicinal stipulations including major depressive disorder, anxiety disorder, and less commonly attention deficit hyperactivity disorder and bipolar disorder [1-3]. Molecular formula and molecular weight of Amitriptyline are C20H23N and 277.403 g/mol respectively. Appearance of Amitriptyline is a white to off-white powder with a freely soluble in water at 25°C.
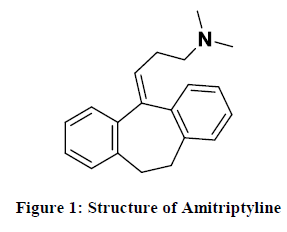
Figure 1: Structure of Amitriptyline
Pregabalin
Pregabalin with chemical name, (3S)-3-(aminomethyl)-5-methylhexanoic acid (Figure 2) is a γ-aminobutyric acid (GABA) derivative that acts as a calcium channel blocker and is used as an anticonvulsant as well as an anti-anxiety agent. It is also used as an analgesic in the treatment of neuropathic pain and fibromyalgia. Pregabalin drug is used to treat epilepsy, neuropathic pain, fibromyalgia, and generalized anxiety disorder [4,5]. Its use for epilepsy is as an add-on therapy for partial seizures with or without secondary generalization in adults. Molecular formula and molecular weight of Pregabalin are C8H17NO2 159.23 g/mol respectively. Appearance of Pregabalin is a white to off-white crystalline powder with freely soluble water at 25°C.
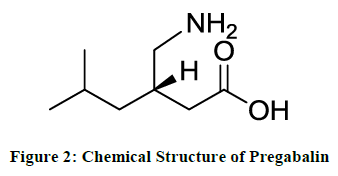
Figure 2: Chemical Structure of Pregabalin
Materials and Methods
Drug substances
Working standards Amitriptyline (99.9%) and Pregabalin (99.9%) were procured from Spectrum Pharma Labs, Hyderabad, India.
Instrumentation
An Agilent-1100, Ultra Performance Liquid Chromatography consisting of ACQUITY Ultra Performance Liquid Chromatography (UPLC) Binary Solvent Manager (part numbers: 186015002), ACQUITY UPLC Sample Manager (part numbers: 186015005) and Waters Empower 2 workstation, Waters Acquity column manager (Part number: 186015007), Waters PDA detector (Part numbers: 186015032), supplied by M/s. Waters, USA. Mettler-Toledo analytical balance, model AG-245 capable of weighing 0.01 mg, supplied by M/s. Mettler AG, Switzerland. Sonicator supplied by M/s. Serwell instrument, India. Digital pH meter supplied by M/s. Serwell instruments, India.
Chemicals and reagents
HPLC grade Acetonitrile was supplied by Merck, India. High Performance Liquid Chromatography (HPLC) grade Orthophosphoric acid supplied by Merck, Bangalore, India. HPLC grade water was supplied by Merck, India.
Mobile phase preparation
Mobile Phase composition: A-0.1% Orto phosphoric acid A in water, B- Acetonitrile, Diluent-Water: ACN (50: 50).
Standard solution preparation
Weighed and transferred 10 mg of Amitriptyline [6-11] and 18.75 mg of Pregabalin [12-15] standards into a 100 ml and 25 ml volumetric flask, add 3/4th volume of diluent, sonicated for 5 min till the sample is dissolved and make up to the final volume with diluent. Pipetted 1 ml of each from the above two stock solutions were taken into a 10 ml volumetric flask and made up to the volume with diluent.
Chromatographic conditions
The mobile phase was a mixture of Mobile Phase: A-0.1% OPA in water and B-Acetonitrile [16]. The contents of the mobile phase were filtered through 0.45 μm membrane filter, degassed for 10 min before it used and flushed the column at a flow rate of 0.2 ml/min, Column: Acquity UPLC HSS C18 (100 × 1.8 μm). The column temperature was maintained at 25°C and run time is 3 min. The injection volume of samples was 1 μl. UV detection was carried out by using a UV-DAD detector at 256 nm.
Method development
After number of experiments [17], different composition of 0.1% OPA, methanol and Acetonitrile were tried with different columns (Acquity UPLC HSS PFP (75 × 2.1 mm, 1.8 μm and ACQUITY UPLC, with HSS T3 Column (2.1 mm × 100 mm, 1.8 μm). The separation of peaks is not satisfactory. The optimum chromatographic conditions were established for better separation, repeatability and reproducibility. For each drug separate standard calibration lines were constructed. A sequence of linearity solutions was prepared from the above stock solutions by using mobile phase to get the concentrations Amitriptyline: 2.5-15 μg/ml Pregabalin: 18.75-112.5 μg/ml. Each concentration was injected 6 times and each time peak area and retention time was recorded separately for both the drugs. Calibration curves were constructed by taking average peak area on Y-axis and concentration on X-axis. From the calibration curves, regression equations were calculated as shown in the Figures 3 and 4. These equations were used for the estimation of drug content in their combined tablet dosage form.
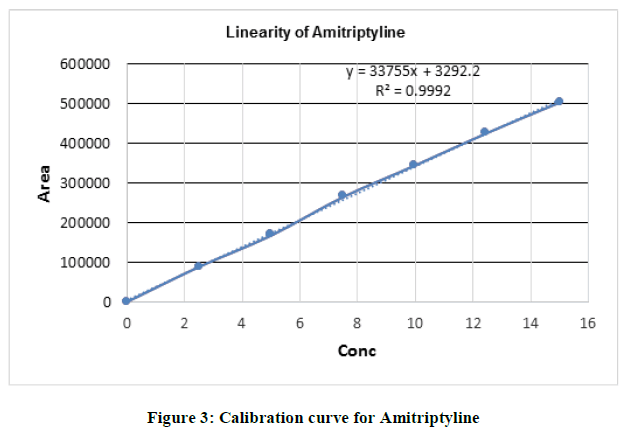
Figure 3: Calibration curve for Amitriptyline
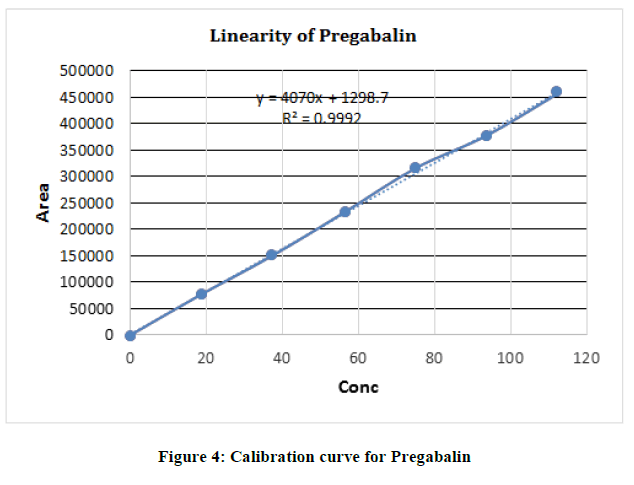
Figure 4: Calibration curve for Pregabalin
Pharmaceutical formulation estimation
For the analysis of solid drug dosage form, 1 tablet was weighed, powdered in mortar and powder was transferred into a 100 ml volumetric flask. Dissolved with 50 ml diluent and sonicated for 25 min, diluted up to the mark with the same. It was filtered through a nylon 0.45 mm membrane filter. From above solution 1 ml was transferred into 10 ml volumetric flasks and diluted with mobile phase to get the required test concentrations, 10 mg/ml of Amitriptyline and 75 mg/ml of Pregabalin. Injected 6 times into the column, chromatograms and respective peak areas were measured. The content of Amitriptyline and Pregabalin were calculated by using the regression equation which was indicated as % Assay. The results are tabulated in Table 1.
| Drug name | Labelled claim (mg) | Test concentration (μg/ml) | Mean Amount estimated (μg/ml) n=6 | Estimated amount % |
|---|---|---|---|---|
| Amitriptyline | 10 | 10 | 9.87 | 99.59 |
| Pregabalin | 75 | 75 | 74.86 | 99.44 |
Table 1: Pharmaceutical formulation estimation
Validation
In this validation repeatability and reproducibility proved for analytical method will consistently produce results meeting its intended analytical applications [18-20].
Accuracy
The recoveries of each drug at three different levels ranging from (50% to 150%) with target concentration of Amitriptyline and Pregabalin (active ingredient) from 5 μg/ml to 15 μg/ml, 37.5 μg/ml to 112.5 μg/ml respectively by adding a known amount of each of the standard to a pre-analysed concentration of all drugs (Amitriptyline and Pregabalin) and calculating the % of recovery. The recovery range and % RSD for all drug found to be 99.2% to 99.8% and 0.38% to 0.70% respectively. The results were tabulated in Table 2.
| Drugs name | Pre analysed concentration (µg/ml) | Amount added (µg/ml) | Amount found (µg/ml) (n=3) | %Recovery |
|---|---|---|---|---|
| Amitriptyline | 10 | 5 | 4.97 | 99.4 |
| 10 | 9.87 | 98.7 | ||
| 15 | 14.9 | 99.3 | ||
| % RSD | 0.38% | |||
| Pregabalin | 75 | 37.5 | 37.2 | 99.2 |
| 75 | 74.9 | 99.8 | ||
| 112.5 | 110.7 | 98.4 | ||
| % RSD | 0.70% |
Table 2: Results of the recovery studies
Precision
The precision of the system was tested by six (n=6) injections and the assay value, % RSD, RT and areas were determined in Table 3. The same day and different days variation in assay calculated and the obtained % RSD were 0.2% to 0.9%, 0.8% to 0.8% respectively. The %RSD value were found be <1.0%. Statistical results revealed that the proposed UPLC method having good intermediate precision. The results are tabulated in Table 3.
| S. No. | Amitriptyline | Pregabalin | ||
|---|---|---|---|---|
| Same Day | Different day | Same Day | Different day | |
| 1 | 341828 | 357822 | 319170 | 410913 |
| 2 | 342788 | 357851 | 314107 | 418518 |
| 3 | 341949 | 350739 | 315144 | 412608 |
| 4 | 341435 | 351228 | 313306 | 419415 |
| 5 | 342587 | 354290 | 319057 | 417098 |
| 6 | 340564 | 357545 | 315434 | 416903 |
| Avg | 341859 | 354913 | 316036 | 415909 |
| St. dev | 807.3 | 3329 | 2501.2 | 3387 |
| %RSD | 0.2 | 0.9 | 0.8 | 0.8 |
Table 3: Method precision
Linearity and range
The linearity of the method was determined in the concentration range of 2.5-15 μg/ml for Amitriptyline and 18.75-112.5 μg/ml for Pregabalin. The graph plotted peak area versus concentration data and data were subjected to statistical analysis by using liner-regression. The results were tabulated in Tables 4, 5 and 6.
| S. No. | Pipetted from stock (ml) | Volume of flask (ml) | Concentration in ppm (Amitriptyline) | Concentration in ppm (Pregabalin) | %Linearity Level |
|---|---|---|---|---|---|
| 1 | 0.25 | 10 | 2.5 | 18.75 | 25 |
| 2 | 0.5 | 10 | 5 | 37.5 | 50 |
| 3 | 0.75 | 10 | 7.5 | 56.25 | 75 |
| 4 | 1 | 10 | 10 | 75 | 100 |
| 5 | 0.25 | 10 | 12.5 | 93.75 | 125 |
| 6 | 0.5 | 10 | 15 | 112.5 | 150 |
Table 4: Linearity solutions of Amitriptyline and Pregabalin
| Amitriptyline | Pregabalin | ||
|---|---|---|---|
| Conc. (µg/ml) | Average peak area | Conc. (µg/ml) | Average peak area |
| 2.5 | 88037 | 18.75 | 77539 |
| 5 | 169866 | 37.5 | 150984 |
| 7.5 | 266793 | 56.25 | 232396 |
| 10 | 346920 | 75 | 315829 |
| 12.5 | 429505 | 93.75 | 377734 |
| 15 | 504725 | 112.5 | 457172 |
Table 5: Calibration data of the proposed method
| Parameters | Amitriptyline | Pregabalin |
|---|---|---|
| Linearity range (µg/ml) | 2.5 ppm-15 ppm | 18.75 ppm-112.5 ppm |
| Regression line equation | y=33755x+3292.2 | y=4070x+1298.7 |
| Correlation coefficient (r) | 0.9992 | 0.9992 |
| LOD (µg/ml) | 0.02 | 0.51 |
| LOQ (µg/ml) | 0.061 | 1.55 |
Table 6: Optical characteristics of Amitriptyline and Pregabalin
LOD and LOQ
The Limit of detection (LOD) and Limit of quantification (LOQ) represents the concentration of the analyte that would yield signal to noise ratio of 3 for LOD and 10 for LOQ respectively. The results were tabulated in Table 7.
| Active | LOD(µg/mL) | LOQ (µg/mL) |
|---|---|---|
| Amitriptyline | 0.02 | 0.061 |
| Pregabalin | 0.51 | 1.55 |
Table 7: LOD and LOQ
Robustness
The robustness of the assay method was set up by introducing small changes in the chromatographic condition which included the percentage of Flow rate (0.1 ml/min and 0.3 ml/min), Mobile Phase (50 OPA: 50 ACN and 60 OPA: 40 ACN) and Temperature (20°C and 30°C). The results were tabulated in Table 8.
| Method parameters | Conditions | Retention Time (RT) Amitriptyline | Retention Time (RT) Pregabalin |
|---|---|---|---|
| Flow Rate+ | 0.3 ml/min | 1.6 | 1.92 |
| Flow Rate- | 0.1 ml/min | 1.76 | 2.11 |
| Mobile Phase+ | 50 OPA: 50 CAN | 1.76 | 2.13 |
| Mobile Phase- | 60 OPA: 40 CAN | 1.68 | 2.01 |
| Temperature+ | 30°C | 1.68 | 2.01 |
| Temperature- | 20°C | 1.68 | 2.01 |
Table 8: Robustness studies of Amitriptyline and Pregabalin
Solution stability
The solution stability of the Amitriptyline and Pregabalin for the assay method was established and checked at room temperature for 24 h by leaving both the sample and standard solutions in tightly capped volumetric flasks. The assay results were found within the acceptance criteria for Amitriptyline and Pregabalin.
System suitability parameters
The system suitability of the system was checked by preparing six replicates injections of Amitriptyline and Pregabalin and the system is deemed suitable for use of plate number (N), resolution, and retention time of samples. The results were tabulated in Table 9.
| Parameter | Amitriptyline | Pregabalin |
|---|---|---|
| Retention time | 1.7 | 2.04 |
| Plates | 7254 | 2653 |
| Resolution | - | 2.8 |
Table 9: System suitability parameters
Specificity and selectivity
Specificity is the ability of method to measure the analyte response in the presence of mixed analyte. The specificity of the method was established without any interference of placebos. The UPLC chromatograms recorded for the drug matrix (a mixture of the drug and placebos) observed that almost no interfering peaks within retention time of analyte range. Figures 5 and 6 shows the respective chromatogram for Amitriptyline and Pragabalin with a blank. Figure 6 shows that the selected drugs were well separated and hence the proposed UPLC method in this study was selective.
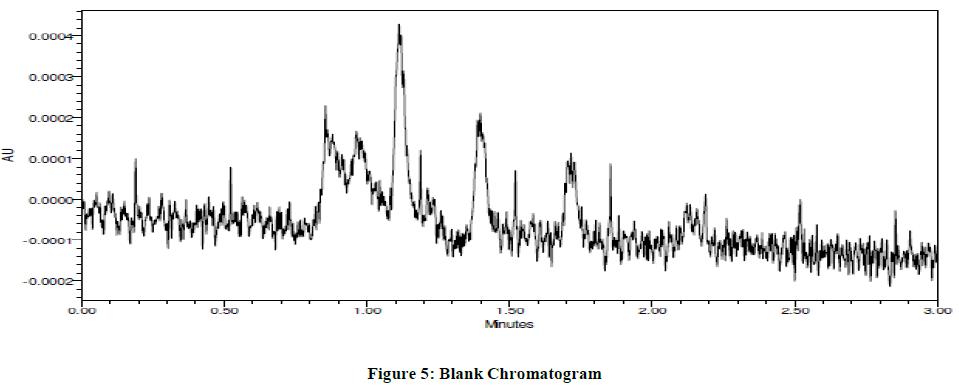
Figure 5: Blank Chromatogram
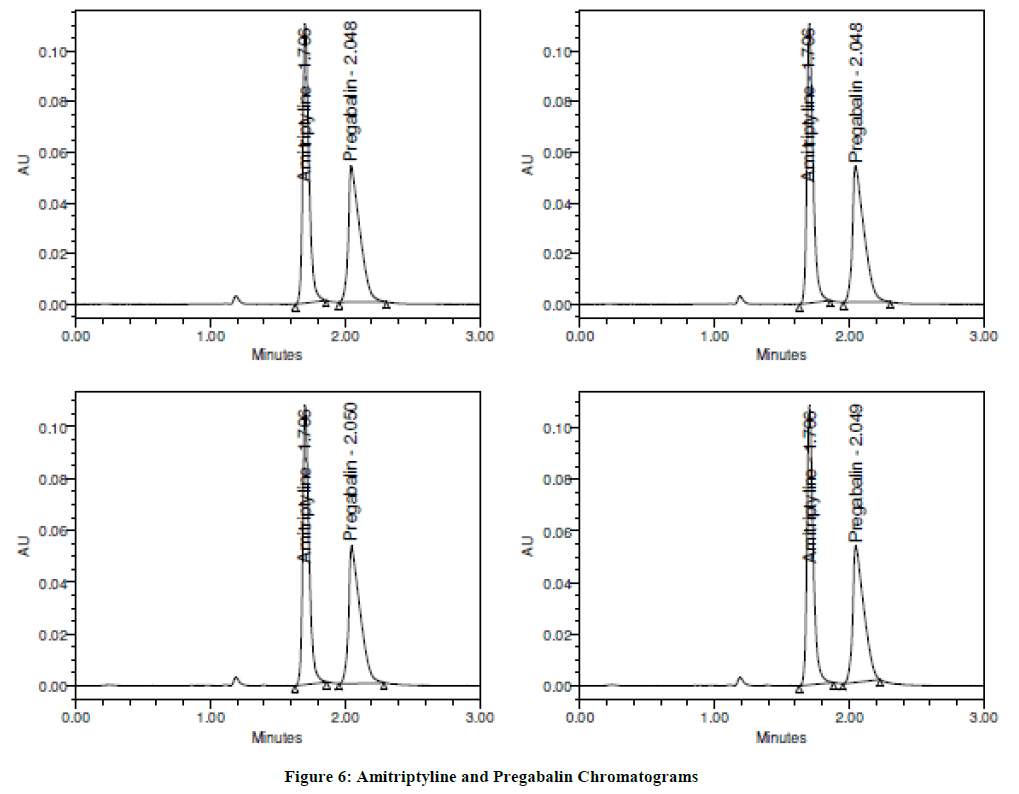
Figure 6: Amitriptyline and Pregabalin Chromatograms
Stress degradation studies
Stability testing [21,22] is performed to warrant that drug products do not degrade until the self-life completion. Stability testing will play an important role in the process of drug product development and validation. The rationale of stability testing is to provide indication that how the quality of a drug substance or drug product differ with the influence of a variety of environmental factors such as temperature, relative humidity and light. Based on the stability studies (long term, intermediate and accelerated studies) establishes a retest period for the drug substance or a shelf life for the drug product. The assay of drug product in stability samples needs to be analysed by using stability indicating parameters, as recommended by the International Conference on Harmonization (ICH) guidelines [23].
Preparation of stock solution
Weighed separately and transferred 10 mg of Amitriptyline and 18.75 mg of Pregabalin sample into a 100 ml and 25 ml clean dry volumetric flask, add 3/4th volume of diluent, sonicated for 5 min and make up to the volume with diluent.
Acid degradation studies
Take 1 ml of each sample stock solution of Amitriptyline and Pregabalin, added separately 1 ml of 2 N Hydrochloric acid was added and refluxed for 30 min at 60°C. The resultant solution was diluted to obtain 10 μg/ml, and 75 μg/ml solutions.
Alkali degradation studies
Take 1 ml of each sample stock solution of Amitriptyline and Pregabalin, added 1 ml of 2 N sodium hydroxide and refluxed for 30 min at 60°C. The resultant solution was diluted to obtain 10 μg/ml and 75 μg/ml solution.
Oxidation
Take 1 ml of each sample stock solution of Amitriptyline and Pregabalin and added separately 1 ml of 20% hydrogen peroxide (H2O2). The solutions were kept for 30 min at 60°C. The resultant solution was diluted to obtain 10 μg/ml & 75 μg/ml solution and the chromatograms were recorded to assess the stability of sample.
Dry heat degradation studies
The standard drug solution was placed in oven at 105°C for 1 h to study dry heat degradation. The resultant solution was diluted to 10 μg/ml and 75 μg/ml solution and the chromatograms were recorded.
Photo stability studies: (PG instruments T60 UV-visible spectrophotometer)
The photochemical stability of the drug was also studied by exposing the 100 μg/ml and 750 μg/ml solution to UV Light by keeping the beaker in UV Chamber for 1 day with 200 Watt hours/m2 in photo stability chamber. The resultant solution was diluted to obtain 10 μg/ml and 75 μg/ml solutions.
Neutral degradation studies
Stress testing under neutral conditions was studied by refluxing the drug in water for 1 h, temperature of 60°C. The resultant solution was diluted to 10 μg/ml and 75 μg/ml solutions. The results were tabulated in Table 10.
| Stress conditions | Active present after degradation (%) | |
|---|---|---|
| Amitriptyline | Rilpivirine | |
| Acid | 30 | 48 |
| Alkali | 30 | 48 |
| Dry Heat | 53 | 47 |
| Oxidation | 53 | 47 |
| Photo Stability | 53 | 47 |
| Neutral | 53 | 47 |
Table 10: Results of stress degradation studies
Conclusion
Stress testing (or forced degradation studies) is one of the most critical criteria in pharmaceutical industries in method development. A simple, expeditious, accurate and precise stability-indicating UPLC analytical method was developed and validated for the quantitative analysis of Amitriptyline and Pregabalin in bulk drugs and combined dosage forms. The present developed UPLC method proved that for separation of different degradation products along with the pure drugs and capable of giving faster retention times with good resolution. The method was exhibited an excellent performance in terms of sensitivity, repeatability and swift. Thus the method could be useful not only for assay but also for monitoring the degradation products during the development as per the ICH guide lines. Hence the proposed method can be applied to the analysis of routine quality control samples. When compared with other methods, this method will decrease the consumption of solvent, time and man power. Hence the method is fit for regular pharmaceutical use.
Acknowledgment
Authors are very thankful to Vice Chancellor and Dean R & D VFSTR, for providing the library facilities for literature survey to carry out entire study. Authors are thankful to Syngene International Pvt. Ltd, Bangalore, India for providing Amitriptyline and Pregabalin working standards as gift samples. Authors are also thankful to Spectrum Pharma Labs, AP, India, for providing instrumental facilities to carry out research work.
References
- http://www.drugbank.ca/drugs/DB00321.
- Amitriptyline Hydrochloride. The American Society of Health-System Pharmacists, Retrieved 3 April, 2011.
- T.B. Vree, A.M. Baars, Y.A. Hekster, E. Van der Kleijn, J. Chrom. B. Biomed. Sci. Appl., 1981, 224(3), 519-525.
- http://www.drugbank.ca/drugs/DB00230.
- V.V. Vaidya, S.M. Yetal, S.M.N. Roy, N.A. Gomes, S.S. Joshi, Chromatographia., 2007, 66, 925-928.
- Indian Pharmacopeia 2014, Government of India ministry of health and family welfare, published by Indian Pharmacopoeia commission, Government of India Ghaziabad, 2014, 1043-1044.
- European Pharmacopoeia supplement 8.7, 2013, Vol-II, 1546-1547.
- British Pharmacopoeia, Vol, Monograph: Medicinal and Pharmaceutical substance: Amitriptyline Hydrochloride, 2016, 151-152.
- United States Pharmacopoeia 38, Rockville M.D., United States Pharmacopeia convention Inc., 2015, 2202-2203.
- T. Vijaya Bhaskar Reddy, G. Ramu, N. Ravindra Babu, C. Rambabu, J. Pharm. Res.,2012, 5(7), 3896-3899.
- T. Vijaya Bhaskara Reddy, G. Ramu, M. Sravan Kumar, C. Rambabu, Asian J. Chem.,2013,25(9),4788-4790.
- Indian Pharmacopeia 2014, Government of India ministry of health and family welfare, published by Indian Pharmacopoeia commission, Government of India Ghaziabad, 2014, 2548-2549.
- European Pharmacopoeia supplement 8.7, 2015, 5801-5803.
- Anonymous, Drug Enforcement Adminisration, Department of Justice. Schedules of controlled substances: Placement of pregabalin in to Schedule V. Final rule. Fed Regist., 2005, 70, 43633.
- T.A. Vermeij, P.M. Edelbroek, J. Chromatogr. B Analyt. Technol. Biomed. Life Sci., 2004, 810, 297-303.
- S. Budavari, The Merck Index, an Encyclopedia of Chemicals, Drugs, and Biologicals, 13th (Edn.), Merck & Co. Inc., Whitehouse Station, NJ, 2001, 86-87.
- L.R. Snyder, J.J. Kirland, J.L. Glajch., Practical HPLC method development, 2nd (Edn.), John Wiley & Sons, Inc., U.S.A., 1997.
- ICH guidelines, Validation of analytical procedures: Text and Methodology, Q2 (R1), 2005.
- International Conference on Harmonization (ICH) of technical requirements for registration of pharmaceuticals for human use Validation of analytical procedures: Text and methodology, ICH-Q2 (R1): Geneva, 2005.
- DIN 32645, Chemical analysis; decision limit; detection limit and determination limit estimation in case of repeatability; terms, methods, evaluation, Beuth Verlag, 1996.
- W. Grimm, D.B. Rib, (In Eds.) W. Grimm, K. Krummer, Stability testing in the EC, Japan and the USA, Scientific and Regulatory Requirements 191, International Association for Pharmaceutical Technology, Paperback APV ed., Stuttgart, 1993.
- S.S. Singh, M. Bakshi, J. Pharm. Biomed. Anal., 2004, 36, 769-775.
- The United States Pharmacopoeia, 26th (Edn.), US Pharmacopoeial Convention, Rockville, MD,
- 2003, Pp. 1151.


