Research Article - Der Pharma Chemica ( 2018) Volume 10, Issue 5
Reuse of Treated Wastewater of the City of Salé in Agriculture
I Majdy, N Boughou*, E Cherkaoui, M Khamar and A Nounah
Water and Environment Higher School of Technology, Laboratory of Energy, Materials and Environment (LEME), Crown Prince BP 227, SALE, Mohammed V University in Rabat, Morocco
- *Corresponding Author:
- I Majdy, N Boughou
Water and Environment Higher School of Technology
Laboratory of Energy, Materials and Environment (LEME)
Crown Prince BP 227, SALE, Mohammed V University in Rabat, Morocco
Abstract
The city of Salé produces about 24 millions m3/year of wastewater. The majority of this water is discharged directly into the Atlantic coast and Bouregreg estuary without any treatment. To preserve the quality of the receiving waters. treating wastewater and reusing it in agriculture proves very interesting. The objective of this study is thus to investigate the treatment and recycling of wastewater in agriculture. We are particularly interested in studying the growth of the stem and the average number of leaves in order to prove the positive effects of reusing treated wastewater in agriculture as compared to untreated wastewater. To achieve this objective. we have investigated the irrigation of the broad bean by three types of water: Untreated wastewater (UW). Well water (WW) and biologically treated wastewater (TW).
Keywords
Wastewater, Biologically treated wastewater, Wastewater reuse and recycling, Agriculture and the broad bean
Introduction
The reuse of biologically-treated wastewaters is an essential component of the integrated management of water resources policy. Indeed, the abundance of fertilizing particles in these treated wastewaters contributes to the recycling of these elements and to the decrease in the excessive use of fertilizers [1].
However, the reuse of wastewater requires a careful and integrated study that takes into account especially its impact on the environment. Although it is a source of pollution because this water contains nutrients. It helps reduce the soil fertilization cost [2-4]. This being said, our work is a comparison between the reuse of treated wastewater and untreated wastewater in agriculture.
Materials and Methods
The waters used in our study were characterized physico-chemically by concentrations such as pH, temperature, conductivity, turbidity, dissolved O2, the Biological Oxygen Demand (BOD5) and the Application Chemical Oxygen Demand (COD).
The monitoring of the pH is done by using a pH meter 206 Lutron, the conductivity using the conductimeter WTW LF90, the turbidity using the turbidimeter portable 2100P, and the COD analysis using the AFNOR NF T 90-101 process. The organic matter content is determined by the evaporation of samples in porcelain capsules weighed at first, then in an oven at 105°C and then reweighed. After conditioning these capsules in oven at 550°C were cooled and reweighed again.
For bacteriological analyses, we have used indicators of fecal pollution such as the method of the most probable number (MPN), which is a statistical estimate of the number of microorganisms supposedly randomly distributed in water. Indeed, this is not an enumerative method which is based on positive responses observed for one or more successive dilutions of the bacterial suspension belonging to liquid culture media. The plant selected in our study is the bean Vicia Faba, which is an annual plant. Its compound leaves are gray-green, its white flowers are followed by large green pods blackening when mature. Its pods contain 4-8 seeds and may be intended for direct consumption. We chose this plant because it is abundant in Salé area and adequate to the soil used in our study.
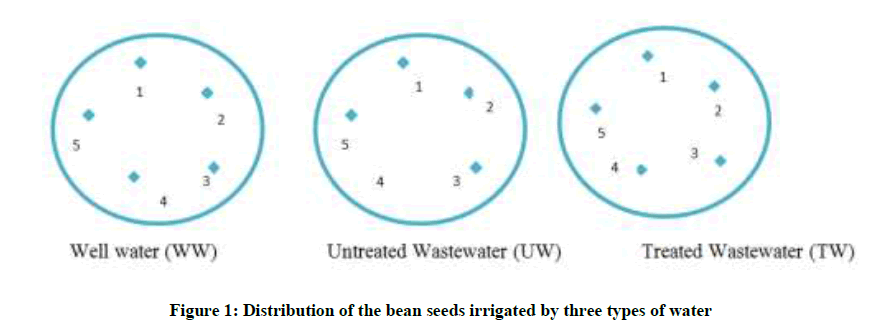
During our research, we used three pots (each pot contains five seeds) and each is irrigated by one of the three water types with an average volume of 80 ml every two days during 13 weeks (Figure 1).
-Untreated waste water: Domestic waste water from city of Salé (Morocco) (UW)
-Well water: extracted from EST high school (WW).
- Treated waste water: treated by biological treatment based on agitation of a quantity of wastewater in our laboratory. This treatment cans degrade the organic materials with micro-organisms presents in this water (TW)
This treatment allowed the degradation of the organic matter by the existing microorganisms in these wastewater
Results and Interpretations
Table 1 shows that the UW and WW are characterized by a neutral pH (7.4) (7.29) with slightly basic pH to the TW (8.32). Indeed, these measured values are acceptable according to the Moroccan standards (6.5 and 8.5) of water quality for irrigation [5-8]. The temperature recorded at the raw sewage oscillates around 21°C. does not exceed 17.9°C for the WW and is in the range of 19.9°C for the TW [8]. The values of the conductivity for three waters are respectively (1981) for UW, (1332) for WW and (1987) μs/cm for TW. Because of the mixing of the domestic and industrial wastewaters in this region, the conductivity obtained may be related to ion mobility contained in domestic waters [4].
| Parameters | UW | TW | WW | Standard range for agriculture reusability [11] |
|---|---|---|---|---|
| pH | 7.4 | 8.32 | 7.29 | 6.5 à 8.4 |
| Temperature (°C) | 21 | 19.9 | 17.9 | 35 |
| Conductivity (µs/cm) | 1981 | 1987 | 1332 | 2700 |
| Turbidity (NTU) | 353 | 226 | 1.33 | - |
| O2 dissolved (mg/l) | 0.47 | 8.36 | 5.2 | - |
| BOD5 (mg (O2) /l) | 500 | 218 | - | - |
| CDO mg (O2) /l | 912 | 652.8 | - | - |
| Total Solids (mg/l) | 570 | 217.4 | 7.2 | 2000 |
| Phophorus (mg/l [SO4-]) | 0.11 | 0.285 x 10⁻³ | 0.18 | 5 |
| Sulphates (mg/l [PO43-]) | 47.4 | 0.8 | 1.3 | 250 |
| Nitrate (mg/l [NO3-]) | 3.85 | 0.817 | 10 | 50 |
| Fecal coliforms (UFT/100 ml) | 2 x 10¹⁰ | 15 x 109 | 1.27 x 10⁴ | 1000/100 ml |
| Fecal streptococce (UFT/100 ml) | 15 x 1010 | 2 x 10⁷ | 7 x 10⁴ | - |
Table 1: Characteristics of three types of water (UW, WW and TW)
The maximum value of turbidity was recorded in untreated wastewater (353 NTU) and the minimum value in well water (1.33 NTU). The values of turbidity as well as COD and BOD5 of the three waters are in range of the Moroccan standards of irrigation water. The COD/BOD5 ratio confirms that waste water from Salé is domestic [9,10].
The concentration of both indicators of fecal pollution; (FC) and (FS) varies according to the three types of waters. The maximum CF is recorded at the UW (2.1010 UFT/100 ml) and the minimum at the WW (1.27 104 UFT/100 ml); whereas SF exhibit maximum concentration in UW (15.1010 UFT/100 ml) and a minimum concentration in WW (7104 UFT/100 ml). The ratio of FC/FS waste water shows a value of more than 4 which confirms that the source of fecal pollution is human.
Based on water standards for agriculture, most of the physicochemical parameters confirm the possibility of reusing the wastewater in Salé area (Table 1) [6].
The concentration of chromium in the three types of water is ≤ 0.01 mg/l. a minimum value which is not determined by the instrument. Copper is respectively about 0.02, 0.04 and 0.06 for the WW. The WB and the TW and barely exceeds the maximum value (2.59 mg/l) for waters for irrigation according to the standards.
The value of lead, zinc and iron simultaneously does not exceed 3.8 mg/l, 11.42 mg/l and 7.39 mg/l for the three types of water.
To determinate the effect of reusing treated and untreated wastewater, we studied the number of leaves by plant and the length of stem. The well water is taken as a control.
We note that we started the irrigation on 26/11/2013 but we started to observe the results after 1 week of irrigation.
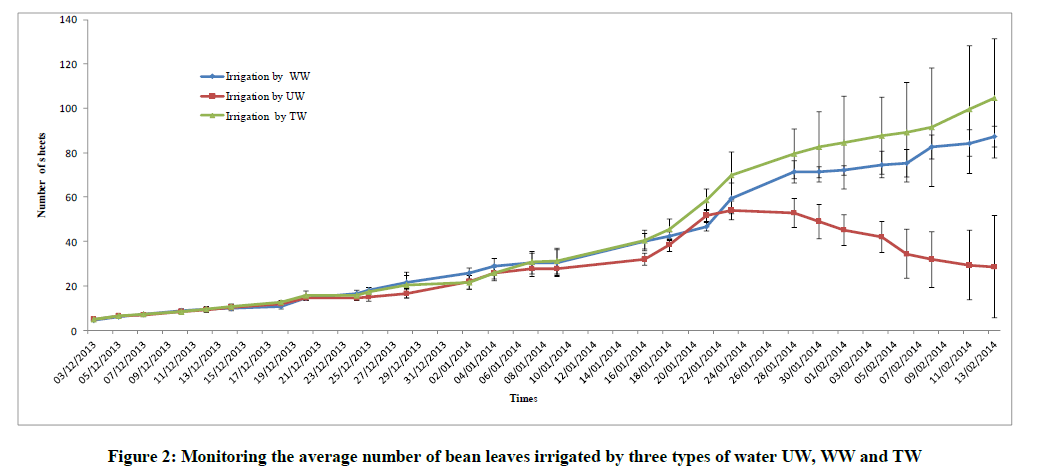
The results show that during the experiment the three types of water resulted in a higher average number of leaves. Thus, the bean plants watered by WW showed an increase in the average number of leaves from 4.33 to 87 while those irrigated by the TW experienced a more significant increase in the number of leaves to an average of 104.5. However, the average number of leaves irrigated by the UW increased during the first 7 weeks with an average number of 52.8 but then decreased to 28.6 in the end of the 13 weeks of irrigation (Figure 2).
In fact, the decrease in the number of leaves irrigated by UW is attributed to the level of organic matters which decreased from 1368 mg in the first week of irrigation to 1003.2 mg in the 7th week. This figure becomes harmful to the bean as compared to 521.76 mg for the TW irrigated bean, which in-turn depicts the increased number of the beans.
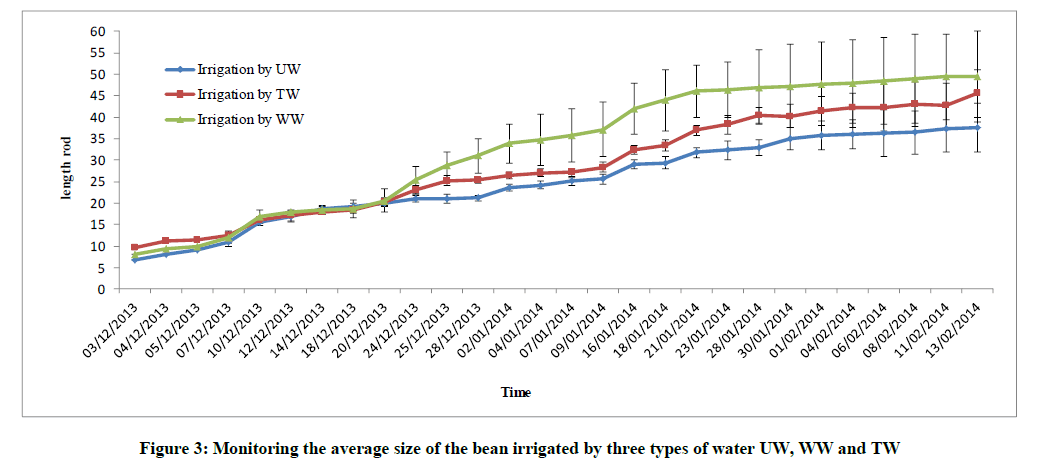
Monitoring the growth of the bean stem during the experiment showed that the contribution of fertilizer elements by the three types of irrigation water had a positive influence on the growth of the stem. Thus, the height of the bean stem is respectively 37. 56 cm for UW, 45.5 cm for TW and 49 cm for the WW (Figure 3).
The results of this study showed that the wastewater used are very rich in minerals causing a decrease in the average number of bean leaves irrigated by UW due to the fall of some leaves.
Supended Solids (57 mg/l) accumulate on the surface and cause a clogging of the soil [12]. confirming that the removal of suspended solids (MES) especially Organic matters is the essential process of wastewater treatment [13-16].
On the one hand, UW high content of nitrates such as 3.85 mg/l puts the plant under stress while absorbing them by its nodules. This was confirmed in a 1992 study. where the results showed that the ion NO4+ wastewater content is immediately absorbed by the soil. which could also explain the nitrification of NH4+ in NO2- and then in NO3- during the transit of UW through the soil and the nodules of the plant [17-19]. Indeed. nitrogen is the element that poses most of the problems in the use of waste waters in agriculture [13-16,20-22].
On the other hand. UW minerals such as orthophosphates of 110 mg/l and sulphate 47.4 mg/l accumulates in the soil and cause the deterioration of the soil structure. the decrease in its long-term fertility [17] and a reduced agricultural production [17-19].
The high average number of bean leaves irrigated by TW indicates the positive impact of biologically treated wastewater on minimizing nitrogen (0.8 mg/l) orthophosphates excess.
Despite the relatively large size of the the bean stem irrigated by the WW, its thickness does not exceed 3 mms unlike those irrigated by TW whose thickness is 5 mm.
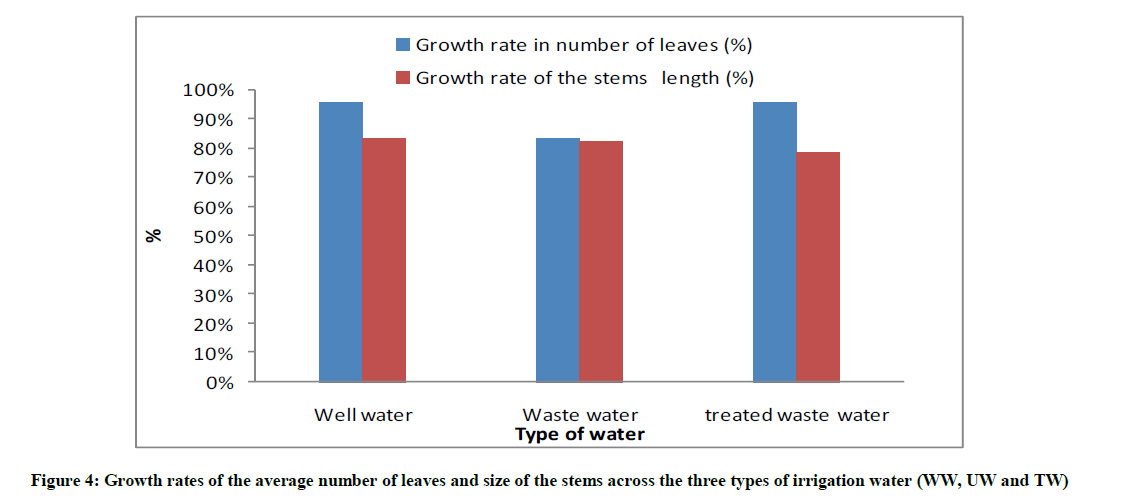
To compare the average number of leaves and average size of the stems across the three types of irrigation water. the growth rates for these two parameters were calculated. The growth rate for the average number of leaves exeeds 95% for WW and TW and is 83.22% for UW. Similarly. the rate for the average size of the bean stems exeeds 81% for WW and TW but is about 78.9% for UW (Figure 4).
The concentration of metals in the treated wastewater is low but the irrigation over a period of time can bioaccumalte these elements in the bean.
Indeed, with the exception of lead, the metallic elements have bioaccumulated in the leaves than in the stems. However, these concentrations remain below the standards [11].
To know the impact of the accumulation of the irrigation water constituents (WW, UW and TW) on the growth of bean as demonstrated by the number of leaves and stem length, we calculated the correlation coefficient (σ) between the irrigation volume and these two parameters. The three types of water and stem length showed a significant positive correlation is about 97% (Table 2).
| Reference (mg/l) | Cr | Cu | Pb | Zn | Fe |
|---|---|---|---|---|---|
| Well Water (WB) | ≤ 0.01 | 0.02 | 0.02 | 1.34 | 0.206 |
| Waste Water (WW) | ≤ 0.01 | 0.04 | 0.03 | 0.3 | 1.68 |
| Treated Water (TW) | ≤ 0.01 | 0.06 | 0.04 | 0.37 | 1.22 |
Table 2: Levels of total metal elements determined in the 3 types of water in mg/l [11]
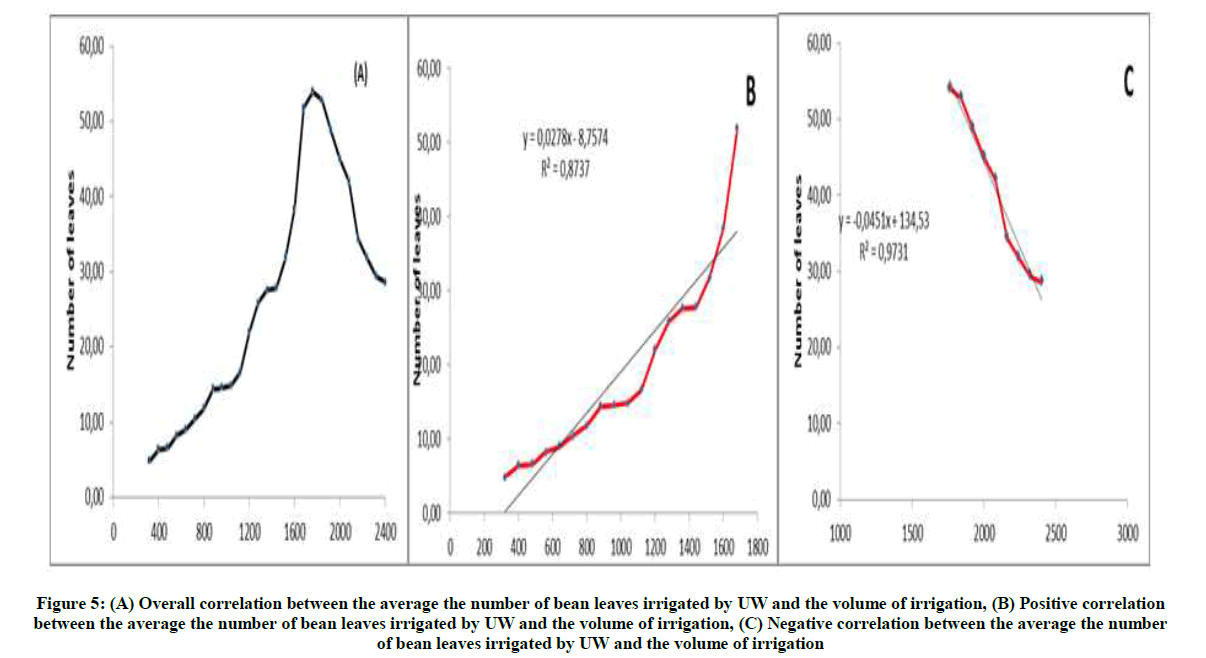
The number of leaves shows a positive correlation across WW and TW. In other words, there is a growth in the number of leaves in accordance with the increase in the volume of irrigation. However, for the number of leaves irrigated by untreated wastewater, the curve shows two parts: the first one with a positive correlation coefficient and the second one where the correlation is negative. This decrease can be explained by the falling leaves as of the 7th week (Figure 5).
Figure 5: (A) Overall correlation between the average the number of bean leaves irrigated by UW and the volume of irrigation, (B) Positive correlation between the average the number of bean leaves irrigated by UW and the volume of irrigation, (C) Negative correlation between the average the number of bean leaves irrigated by UW and the volume of irrigation
According to the least-squares method, both correlations between on the one hand the average number of leaves (Ni) and the volume of irrigation water (V) and on the other hand the average stem length (Li) and the volume irrigation water take the function Y=aX+b where y is either Li or Ni and X is the volume (V) (Table 3).
| Type of water | Number of Leaves | Stem size | ||
|---|---|---|---|---|
| Equation | σ en % | Equation | σ en % | |
| UW part 1 | Ni = 0.0278 V-8.7574 | 93.40% | Li = 0.014 V+4.41 | 98.70% |
| UW part 2 | Ni = -0.00451 V+134.53 | 98.60% | ||
| WW | Ni = 0.0525 V-27.69 | 96.20% | Li = 0.017 V+3.74 | 97.90% |
| TW | Ni = 0.044 V-21.17 | 97.30% | Li = 0.022 V+1.94 | 99.30% |
Table 3: Correlation coefficients for the number of bean leaves and stem length irrigated across three types of irrigation waters
It is worth mentioning that for the monitoring of the average number of bean leaves irrigated by the UW, the curve is characterized by two sides; one has a positive correlation coefficient and the other has a negative coefficient which is due to the fall in the number of bean leaves.
The correlation results above support the need for treatment of wastewater in order to minimize mineral salts that cause the degradation of the soil structure and its long-term fertility [11-23].
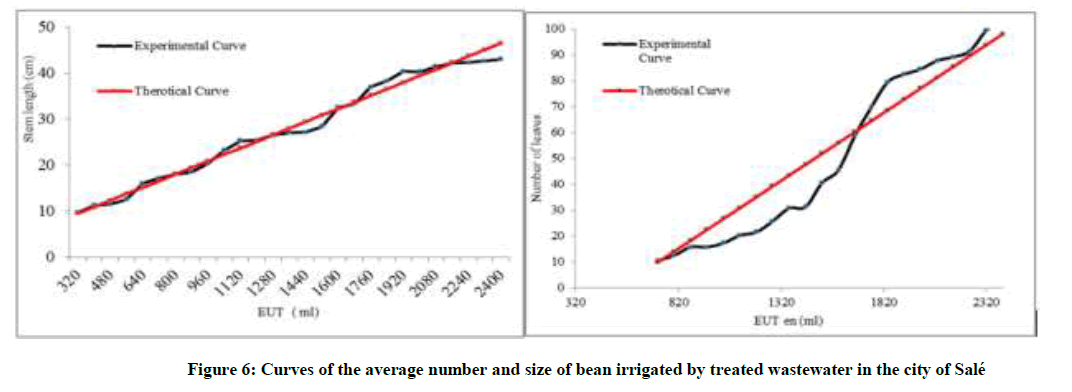
To do a good approximation between the experimental and theoretical curves, we focused on the study of the TW curve which allowed us to check the effect of the TW on the bean agriculture.
The approximation is clearly visible after the juxtaposition of both theoretical and experimental curves representing the volumes of TW across the average number of leaves and the average stem length according to the equations Ni=0.0525 Vi-27.969 for the average number of leaves and Li = 0.0178Vi + 3.7446 for the average stem length (Figure 6).
In this study, we evaluated the influence of the contribution of the three types of water (WW, TW and UW) on the production of the bean. The results indicate that the contribution of wastewater which is rich in nitrogen and phosphorus nutrients, allows an improvement of the stem size and a decrease in the number of the bean leaves. However, it should be noted that the use of biologically-treated wastewater increases the number of bean leaves. In fact, the best results were recorded on the soil irrigated by treated wastewater (TW), which requires the need for the treatment of wastewater in the city of Salé before reusing it in agriculture [10].
Conclusion
The treated wastewater from the city of Salé is in the range of the Moroccan irrigation standards and can be reused in agriculture. In addition, the monitoring of the growth of the bean (the stem and the average number of leaves) irrigated by the TW shows the positive impact of treated wastewater as compared to untreated wastewater which confirms the need for wastewater treatment before its reuse in agriculture.
References
- H. Mouhani, H. Hamdi, A. Bendou, L. Benzine, Water Sci., 2012, 25.
- N. Belaid, Assessment of the impacts of treated wastewater irrigation on plants and soils in the irrigated area of ElHajeb-Sfax: salinisation, accumulation and phytoabsorption of metallic elements, PHD in SFAX University, Sfax, 2010.
- J. Greffard, A. Bourga, Hydrogéology., 1985, 1, 55-64.
- M. Boutayeb, A. Bouzidi, M. Fekhaoui, Bulletin of the Scientific Institute of Rabat. Life Sciences Section.,2002, 34, 2.
- I. Majdy, E. Cherkaoui, A. Nounah, M. Khamar, J. Mater. About. Sci., 2015, 6(3), 834-839.
- B. Sonnenberg, J.C. Holmes, Proceedings TAPPI International Environmental Conference.,Vancouver, BC, 1998.
- S. Guergaz, Larhyss Journal.,2005,2(1), 119-127.
- W. Hamdi, Algerian journal of arid environment.,2012, 2(1), 56-63.
- F. Valiron, Water reuse., 1983,4(1), 34-35.
- Morocco's Ministry of Environment. "Moroccan Standards. Official Bulletin of Morocco", No. 5062 of 30 Ramadan 1423, Rabat, 2002.
- I. Majdy, E. Cherkaoui, A. Nounah, M. Khamar, Eur. J. scient. Res., 2016, 142, 350-356.
- J.A. Faby, F. Brissaud, Water science and technology., 1995, 102, 4-5.
- J. Carre, J. DufIls, Water Science Technology., 1991, 24, 287-293.
- N. El Yamine, Contribution to the qualitative study of the water supply of the main Moroccan cities: problem of keeping. feeding and protection of this quality, PHD in Montpellier University, 1995.
- J. Bechac, P. Boutin, B. Merlier, P. Nuer, Wastewater treatment.,1987.
- C. Boutin, Water Science Technology., 1990, 6.
- T. Suzuki, K. Takao, Y. Gentaro, Water Resources., 1992, 26.
- H. Kathleen, P. Laut, Water Resources., 1992, 26.
- R. Ayers, D. Weston, California Agriculture Experiment Station Bulletin., 1988, 861.
- I. Zoller, Water Resources., 1994, 28-29.
- A. Landreau, Water and Development., 1990, 10.
- E. Lhadi, M. Mountadar, A. Younsi, G. Martin, J. Morvan, Hydrogeology., 1995, 84-85.
- E. Hbaiz, M. Ouihman, M. Lebkiri, D. Ezzarhouny, A. Lebkiri, E. Rifi, Larhyss J., 2014, 1112-3680.

