Research Article - Der Pharma Chemica ( 2018) Volume 10, Issue 10
Quantitative Structure Activity Relationship Study of Naphthoquinone Analogs as Possible DNA Topoisomerase Inhibitors
Prabha T1*, Kaviarasan L2 and Sivakumar T1
1Department of Pharmaceutical Chemistry, Nandha College of Pharmacy, Koorapalayam Pirivu, Pitchandam Palayam Post, Erode-638052, Tamilnadu, India
2Department of Pharmaceutical Chemistry, JKK Nattraja College of Pharmacy, Kumarapalayam, Namakkal-638183, Tamilnadu, India
- *Corresponding Author:
- Prabha T
Department of Pharmaceutical Chemistry
Nandha College of Pharmacy
Koorapalayam Pirivu, Pitchandam Palayam Post, Erode-638052, Tamilnadu, India
Abstract
Quantitative Structure Activity Relationship (QSAR) is among the most widely used computational technology for analogue-based drug design. A molecular modeling approach of Naphthoquinone (NQ) analogue as anticancer activity from recently reported literature were taken and was QSAR model was generated by using MOE 2009.10. DNA topoisomerases are enzymes that alter DNA topology by causing and resealing DNA strand breaks. The quinone nuclei, which can inhibit the activity of topoisomerase. In order to develop a new pharmacophoric model for this inhibition, a QSAR approach of reported NQ derivatives against cancer cell has been studied. Multiple linear regression analysis was performed to derive the quantitative structure activity relationship models which were further evaluated internally as well as externally for the prediction of activity. Accurate IC50 values (μM) were collected for 26 analogs, and other descriptor parameters, such as log p (o/w), MR, DM, EELE, LUMO, HOMO, and TPSA were compared with these compounds. A training set of 26 analogs, all having a common NQ moiety, provided a cross-validated correlation coefficient (r2) value of 0.10835 and root mean square error value of 0.3951. The resulting QSAR pharmacophore model generated from the present study should be useful in the design a similar group of more potent substituted compounds of NQ targets as anticancer agents. Moreover, based on this QSAR study we have developed the 20 newly designed NQ derivatives and estimated their predicted IC50 values theoretically by using trainpred.fit file which is generated by QSAR study of the training set compounds.
Keywords
QSAR, Naphthoquinone derivatives, Molecular descriptors, Topoisomerase inhibitors.
Introduction
Cancer is the second most common cause of death worldwide. Carcinogenic lacerations have been associated with deficient DNA repair. DNA topoisomerases are enzymes that alter DNA topology by causing and resealing DNA strand breaks. Tumors with high cell proliferation articulate these enzymes more than in normal cells, making topoisomerases good targets for the discovery of novel anticancer drugs [1]. The two types of DNA topoisomerases, i.e. Type I DNA topoisomerases (Topo I) break and rejoin only one of the two strands during catalysis, while Type II topoisomerases (Topo II) catalyze DNA topological changes by breaking both strands of the double helix and transporting another double-stranded DNA segment through the break and then re annealing the break [2]. On the other hand Topo II play an important role in DNA transaction in vivo, including chromosome condensation and segregation, and the removal of the super coils generated during replication and transcription [3] Studies in eukaryotes have shown Topo I to be associated with actively transcribed genes [4,5] whereas, Topo II is required for DNA replication and for successful traverse of mitosis [6-9].
Based on overall survival rates of cancer patients, which make us to vital search for new therapeutic agents to control cancer hopefully, which can be achieved by the development of novel compounds with promising anticancer activity. The numerous natural or synthetic substances containing the quinone nuclei, which is one of well-known nuclei can inhibit the activity of topoisomerase. The cytotoxic activity shown by this nuclei is mainly due to inhibition of DNA Topo II, through DNA alkylation or intercalation thereby, inhibiting the heat shock protein HSP90 and as well as through the formation of semiquinones and superoxide radicals, which contribute to the production of hydroxyl radical, the main source of oxidative generated damage to cellular DNA [10-12].
It has been established that many of the biological effects of quinone derivatives Such as the antitumor, antiproliferative, antibacterial, anti-inflammatory, antimalarial, antiviral, antifungal and antileishmanial effects depend on their 1,4-NQ pharmacophore group. NQs are molecules widely distributed in nature that possess a broad spectrum of biological activities and especially those containing nitrogen, have promising potential for the treatment of different diseases, including antibacterial, antifungal, antiviral, antiparasitic effects and anticancer activity [13,14].
Moreover, the incorporation of nitrogen and sulfur atoms on C2 and C3 of the 1,4-NQ lead could produce the compounds with diverse biological activities, including anticancer activity [15]. 1,4-NQ derivatives with an amino group at the 2-position have been reported to have good anti-neoplastic, [16,17] carcinostatic actions [18] and bacterial growth inhibition [19].
The increasing global cancer burdens its health and socio-economic impacts, the presence of drug resistance, etc. leads to the search for newer therapeutic agents with divergent and unique structure and with a mechanism of action possibly different from that of existing drugs are urgently required to tackle the menace. Therefore, the aim of this study is related to look for a newer analogue for the treatment of cancer with the help of Quantitative Structure Activity Relationship (QSAR) study on previously reported work [20]. This study suggests that, to build a QSAR model using multiple regression methods for NQ derivatives to explore the substitution requirement which is essential for the improvement of anticancer activity.
QSAR research has been considered a major tool in drug discovery to explore the ligand-receptor/enzyme interactions, especially when the structural details of the target are not known. QSAR can aid in identifying functional groups with their various structural parameters used to increase the bioactivity leads designing new structures with the variation in enhanced bioactivity depends on changes in chemical structure [21]. QSAR is an effective way for optimizing or correlating the biological activity within a congeneric sequence with certain structural parameters or with functional determinants, such as lipophilicity, polarizability, or electronic and steric properties [22]. Once a correlation between structure and activity/property is found, any number of compounds including those not synthesized, yet can readily be screened for the selection of structures with desired properties [23].
Moreover, in this proposed quantitative model, we tried to interpret the activity of these compounds based on the different multivariate statistical analysis methods like, the principal components analysis (PCA) and contingency analysis (CA), which is served to classify the compounds according to their activities and the variability of the descriptors. It allows reducing the number of variables not significant and making the information less redundant. The multiple linear regressions have served to select the descriptors used as the input parameters for the multiples non-linear regression and cross-validation to validate models used with the process leave-one-out (LOO). This study has an urge to put new efforts for finding new anticancer candidates with novel modes of action and to develop pipelines for drug discovery and development.
Materials and Methods
IC50 is defined as the concentration of an inhibitor where the response (or binding) is reduced by half. IC50 values were manually converted into pIC50 (predicted IC50) using the formula of pIC50=-log IC50. For the development of QSAR models of NQ analogues, a total number of 26 compounds selected from previously reported literature [20] and have been processed by using the software MOE 2009.10. Biological activity was selected as the dependent variable and around 7 molecular descriptors were selected as independent variables. The dataset molecules are validated by both internal and external validation procedures.
Dataset
Thus, in this study we have selected a series of 26 NQ derivatives as training set which was previously synthesized by Julio et al., and they have investigated for their anticancer activity against HT-29 cells. Moreover, their results suggest that the toxicity is improved in molecules with tricyclic naphtho[2,3-b]furan-4,9-dione and naphtho[2,3-b]thiophene-4,9-dione systems 2-substituted with an electron-withdrawing group hence provide the hopeful hits for further anticancer drug development [20]. So, an attempt was made to establish a quantitative structure-activity relationship between anticancer activities with the series of 26 bioactive molecules derived from NQ moieties were performed by using multiple linear regression analysis. The structures of the training set of 26 NQ analogues were represented in Table 1. The micromolar concentration of IC50 (μM) values was first converted into logarithmic values for performing the QSAR study. The Biological data used in this study were IC50 values of NQ derivatives which are having an anticancer activity (Table 1).
| Code | Structure | IC50 (µM) | pIC50 (µM) | ||
|---|---|---|---|---|---|
| Observed | Predicted | Residual | |||
| 1 | 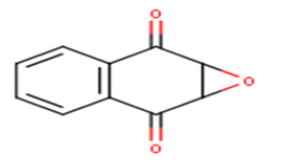 |
10.76 | 4.9682 | 4.5907 | 0.3775 |
| 2 | 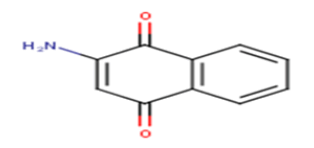 |
24.6 | 4.6091 | 4.5819 | 0.0272 |
| 3 | 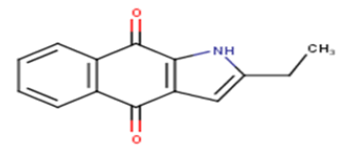 |
40.18 | 4.396 | 4.7463 | -0.3503 |
| 4 | 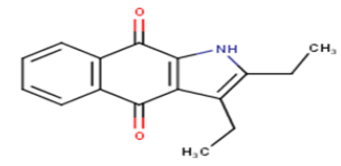 |
68.71 | 4.163 | 4.8636 | -0.7006 |
| 5 | 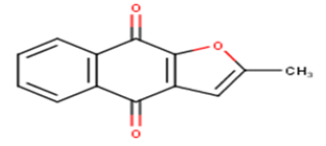 |
17.62 | 4.754 | 4.7019 | 0.0521 |
| 6 | 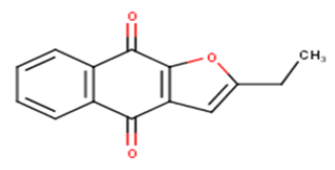 |
24.95 | 4.6029 | 4.7509 | -0.148 |
| 7 | 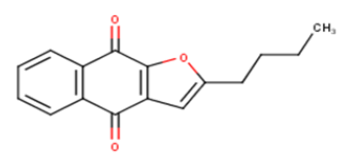 |
21.68 | 4.6639 | 4.8557 | -0.1918 |
| 8 | 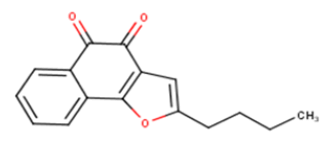 |
9.16 | 5.0381 | 4.8602 | 0.1779 |
| 9 | 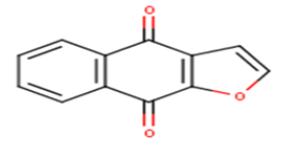 |
8.2 | 5.0862 | 4.6545 | 0.4317 |
| 10 | 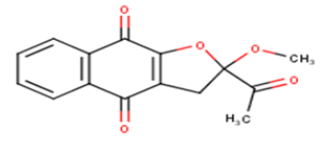 |
34.85 | 4.4578 | 4.95 | -0.4922 |
| 11 | 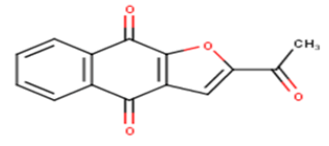 |
4.61 | 5.3363 | 4.7915 | 0.5448 |
| 12 | 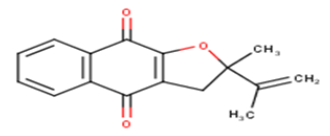 |
25.79 | 4.5885 | 4.8725 | -0.284 |
| 13 | 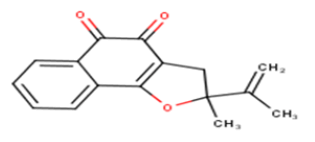 |
28.08 | 4.5516 | 4.8752 | -0.3236 |
| 14 | 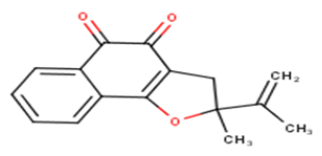 |
30.25 | 4.5193 | 4.9198 | -0.4005 |
| 15 | 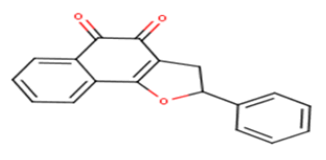 |
14.76 | 4.8309 | 4.9226 | -0.0917 |
| 16 | 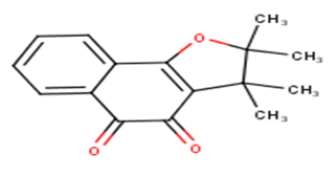 |
18.11 | 4.7421 | 4.9093 | -0.1672 |
| 17 | 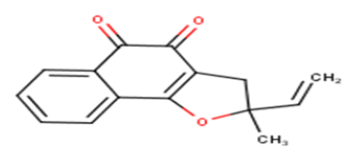 |
88.1 | 4.055 | 4.8148 | -0.7598 |
| 18 | 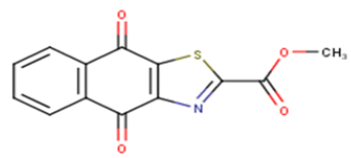 |
13.9 | 4.857 | 4.8406 | 0.0164 |
| 19 | 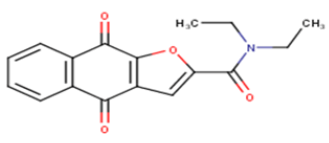 |
2.67 | 5.5735 | 5.0267 | 0.5468 |
| 20 | 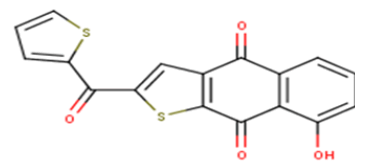 |
1.73 | 5.762 | 50129 | 0.7491 |
| 21 | 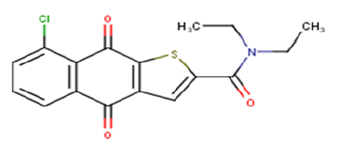 |
6.89 | 5.1618 | 5.0787 | 0.0831 |
| 22 | 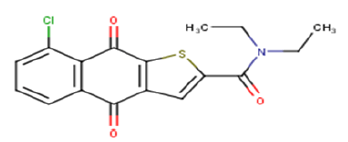 |
3.07 | 5.5129 | 5.0252 | 0.4877 |
| 23 | 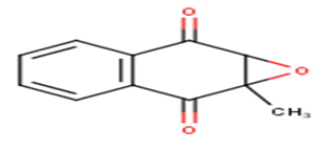 |
4.242 | 4.242 | 4.6408 | -0.3988 |
| 24 | 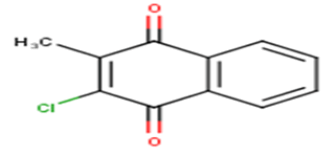 |
4.9578 | 4.9578 | 4.631 | 0.3268 |
| 25 | 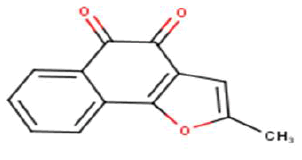 |
5.0778 | 5.0778 | 4.7026 | 0.3752 |
| 26 | 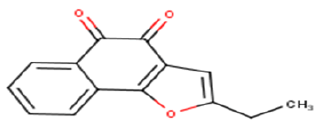 |
4.8639 | 4.8639 | 4.7519 | 0.112 |
Table 1: Molecular structure with observed and predicted activity of naphthoquinone derivatives used in training set
Molecular descriptors
In this QSAR study, an about 7 descriptors were chosen to describe the structure of the compounds comprising the series to study viz. partition coefficients, molar refractivity, dipole moment, electrostatic interactions, lowest unoccupied molecular orbital (LUMO), highest unoccupied molecular orbital (HOMO), and topological polar surface area.
QSAR study
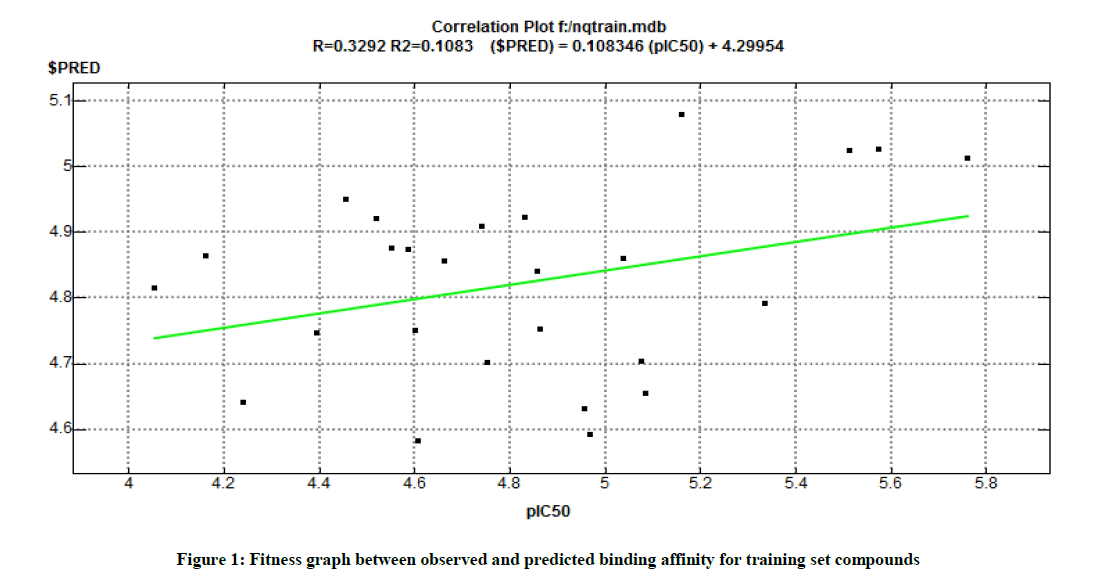
QSAR is an application of combinatorial chemistry to analyze experimental data and to build numerical models of the data for the prediction and interpretation. QSAR analysis was performed for 26 NQ compounds with their biological activity related to cancer, which was collected from the earlier reported literature [20] and the analysis was done by using the QSAR module on the software MOE 2009.10 [24]. The QSAR model was constructed for the above compounds with 7 selected molecular descriptors from the QSAR descriptor panel. The experimentally measured pIC50 (μM) for the 26 compounds of NQ derivatives against HT-29 cells were entered manually in the activity fields. The regression analysis was performed; the RMSE and R2 values were derived from the QSAR fit. $PRED descriptor is the dependent variable for the activity field pIC50 generated by QSAR validate. A QSAR correlation plot was generated by plotting the values of pIC50 on the x-axis and the predicted values ($PRED) on the y-axis for all the above 26 compounds. Furthermore, in order to identify the active compounds in the training set QSAR Contingency application was implemented and followed by principal component analysis (PCA) were performed and accordingly plotting a 3D graphical scatter plot with three vector values [25].
Design of new naphthoquinone derivatives
Based on the above QSAR model interpretation results in the identification of key structural features for improving the potency of the NQ molecules, which is used as a reference for building the newest NQ pharmacophore series. Therefore, the libraries of new structures containing the 20 compounds have been developed based on these QSAR results of NQ molecules (Table 2). Therefore, in this study, we investigated the newly designed 20 compounds of NQ derivatives containing nitrogen, oxygen and sulfur atoms, for their prediction as potential anticancer activity by the help of in-silico biological assays done on the QSAR study.
| Compound | Structure | IUPAC name | Compound | Structure | IUPAC name |
|---|---|---|---|---|---|
| L1 | 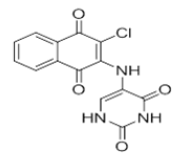 |
5-((3-chloro-1,4-dioxo-1,4-dihydronaphthalen-2-yl)amino)pyrimidine-2,4(1H,3H)-dione | L11 | 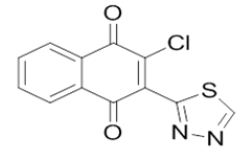 |
2-chloro-3-(1,3,4-thiadiazol-2-yl)naphthalene-1,4-dione |
| L2 | 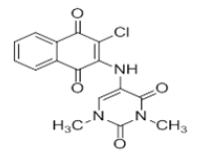 |
5-((3-chloro-1,4-dioxo-1,4-dihydronaphthalen-2-yl)amino)-1,3-dimethyl pyrimidine -2,4(1H,3H)-dione | L12 | 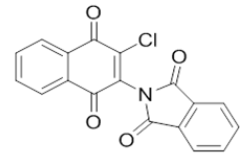 |
2-(3-chloro-1,4-dioxo-1,4-dihydronaphthalen-2-yl)isoindoline-1,3-dione |
| L3 | 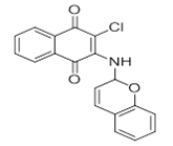 |
2-((2H-chromen-2-yl)amino)-3-chloronaphthalene-1,4-dione | L13 | 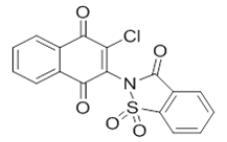 |
2-chloro-3-(1,1-dioxido-3-oxobenzo[d]isothiazol-2(3H)-yl)naphthalene-1,4-dione |
| L4 | 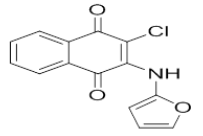 |
2-chloro-3-(furan-2-ylamino)naphthalene-1,4-dione | L14 | 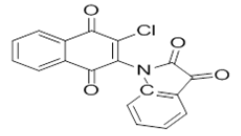 |
1-(3-chloro-1,4-dioxo-1,4-dihydronaphthalen-2-yl)indoline-2,3-dione |
| L5 | 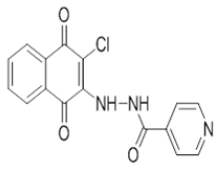 |
N'-(3-chloro-1,4-dioxo-1,4-dihydronaphthalen-2-yl)isonicotinohydrazide | L15 | 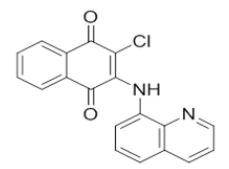 |
2-chloro-3-(quinolin-8-ylamino)naphthalene-1,4-dione |
| L6 | 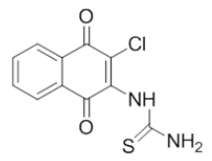 |
1-(3-chloro-1,4-dioxo-1,4-dihydronaphthalen-2-yl)thiourea | L16 | 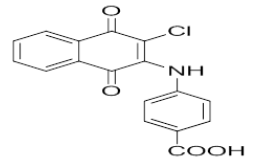 |
4-((3-chloro-1,4-dioxo-1,4-dihydronaphthalen-2-yl)amino)benzoic acid |
| L7 | 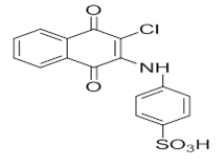 |
4-((3-chloro-1,4-dioxo-1,4-dihydronaphthalen-2-yl)amino)benzenesulfonic acid | L17 | 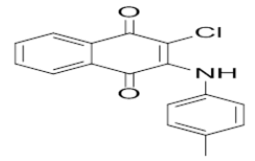 |
2-chloro-3-(p-tolylamino)naphthalene-1,4-dione |
| L8 | 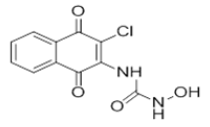 |
1-(3-chloro-1,4-dioxo-1,4-dihydronaphthalen-2-yl)-3-hydroxyurea | L18 | 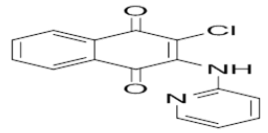 |
2-chloro-3-(pyridin-2-ylamino)naphthalene-1,4-dione |
| L9 | 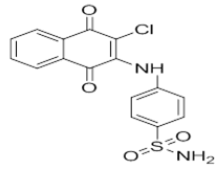 |
4-((3-chloro-1,4-dioxo-1,4-dihydronaphthalen-2-yl)amino)benzenesulfonamide | L19 | 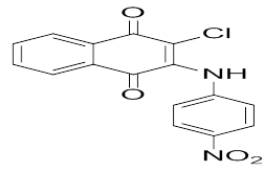 |
2-chloro-3-((4-nitrophenyl)amino)naphthalene-1,4-dione |
| L10 | 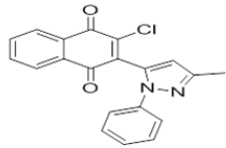 |
2-chloro-3-((3-methyl-1-phenyl-1H-pyrazol-5-yl)amino)naphthalene-1,4-dione | L20 | 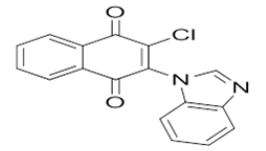 |
2-(1H-benzo[d]imidazol-1-yl)-3-chloronaphthalene-1,4-dione |
Table 2: Designed naphthoquinone derivatives for QSAR study
Result and Discussion
In this study, training sets of 26 compounds were subjected to linear free energy regression analysis for model generation. Preliminary analysis was carried out in terms of correlation analysis. The correlations coefficients of different molecular descriptors with anticancer activity are presented in Table 3. Some statistically significant QSAR models were chosen for discussion. The derived models in QSAR from multiple linear regression shows good correlation between biological activity and parameters. The descriptors showed the positive correlation among all parameters selected for the QSAR model. The positive coefficients suggest that inclusion of such nitrogen, sulphur and oxygen atoms in the molecules lead to increase the biological activity. The computed molecular descriptors reported and predicted biological activities (pIC50) of the ligand training set were shown in Table 1.
In order to validate the anticancer activity, the QSAR model was constructed for these 26 compounds with experimentally derived pIC50 (μM) values, system predicted pIC50, $PRED, and all other standard molecular descriptors and reported in Tables 1 and 3. Further, the regression graph was plotted for pIC50 vs. $PRED (Figure 1). A cross-validated correlation coefficient (r2) value is 0.1084 and root mean square error value is 0.3951. The Z-Score was predicted for all the compounds, wherein a Z-score value of 2.5 and above can be considered to indicate the molecules which are outliers to the fit and showed in Table 3. All the compounds showed significant Z-scores and represented in Table 3. The principal component analysis was carried out using three eigenvalues, viz. PCA1, PCA2 and PCA3, and a 3D graphical plot was generated, which included 98% of the variance and presented. In the plot, all the values were found to lie in the range of 3 to +3 and are shown with different colored spots which correspond to the pIC50 of compounds. The result of contingency analysis showed the selected training set for QSAR study was good and all are within the standard limit as suggested. The value of C (contingency coefficient) should be above 0. 6, V (cramer's V) should be above 0.2, U (entropic uncertainty) should be above 0.2 and R (linear Correlation) should be above 0.2., then only this contingency analysis is considered as useful (Table 4).
| S. No. | log P(o/w) | DM | EELE | HOMO | LUMO | MR | TPSA | $RES | $Z-SCORE |
|---|---|---|---|---|---|---|---|---|---|
| 1 | 0.814 | 1.9141 | -261336.29 | -10.3647 | -1.2656 | 4.5044 | 46.67 | 0.3775 | 0.9555 |
| 2 | 1.057 | 2.0434 | -254694.87 | -9.1754 | -1.3324 | 4.8214 | 60.16 | 0.0272 | 0.069 |
| 3 | 2.631 | 1.8422 | -378579.96 | -9.1481 | -1.2291 | 6.5132 | 49.93 | -0.3503 | 0.8866 |
| 4 | 3.363 | 4.6168 | -466949.78 | -8.9827 | -1.2181 | 7.4459 | 49.93 | -0.7006 | 1.7732 |
| 5 | 1.893 | 0.4905 | -345145.06 | -9.5863 | -1.5212 | 5.8623 | 47.28 | 0.0521 | 0.1318 |
| 6 | 2.368 | 0.4806 | -382014.4 | -9.6079 | -1.5113 | 6.3454 | 47.28 | -0.148 | 0.3745 |
| 7 | 3.252 | 0.4578 | -461026.59 | -9.5739 | -1.5047 | 7.2918 | 47.28 | -0.1918 | 0.4855 |
| 8 | 3.252 | 5.3749 | -464380.9 | -9.0448 | -1.4934 | 7.2918 | 47.28 | 0.1779 | 0.4533 |
| 9 | 1.679 | 1.0067 | -309412.93 | -9.9066 | -1.5734 | 5.4049 | 47.28 | 0.4317 | 1.0926 |
| 10 | 1.804 | 1.5618 | -532032.37 | -9.8753 | -1.6027 | 7.0209 | 69.67 | -0.4922 | 1.2457 |
| 11 | 1.448 | 3.618 | -412647.62 | -10.14 | -1.8255 | 6.4016 | 64.35 | 0.5448 | 1.3788 |
| 12 | 2.638 | 0.8638 | -473690.46 | -9.6289 | -1.5011 | 7.15 | 43.37 | -0.284 | 0.7189 |
| 13 | 2.638 | 5.3298 | -475680 | -9.2366 | -1.4684 | 7.15 | 43.37 | -0.3236 | 0.8198 |
| 14 | 3.313 | 1.0199 | -509260.62 | -9.6489 | -1.5574 | 7.8897 | 43.37 | -0.4005 | 1.0135 |
| 15 | 3.313 | 5.0389 | -511396.96 | -9.2955 | -1.5167 | 7.8897 | 43.37 | -0.0917 | 0.2321 |
| 16 | 2.999 | 4.9787 | -501379.15 | -9.2375 | -1.4231 | 7.1658 | 43.37 | -0.1672 | 0.4232 |
| 17 | 2.594 | 5.1465 | -420172.9 | -9.2339 | -1.4486 | 6.7043 | 43.37 | -0.7598 | 1.9229 |
| 18 | 1.393 | 4.0727 | -449597.93 | -10.3699 | -2.0563 | 7.1081 | 73.33 | 0.0164 | 0.0416 |
| 19 | 1.773 | 3.7769 | -589837 | -9.7466 | -1.7513 | 8.1776 | 67.59 | 0.5468 | 1.3839 |
| 20 | 3.145 | 3.0897 | -579448.93 | -9.5721 | -1.6489 | 8.9661 | 71.44 | 0.7491 | 1.8959 |
| 21 | 3.178 | 4.0484 | -629022.62 | -9.8442 | -1.7286 | 9.2554 | 54.45 | 0.0831 | 0.2103 |
| 22 | 3.181 | 2.2871 | -588681.93 | -9.953 | -1.9288 | 8.8964 | 73.06 | 0.4877 | 1.2344 |
| 23 | 1.221 | 1.9162 | -299093.59 | -10.3269 | -1.2336 | 4.9463 | 46.67 | -0.3988 | 1.0093 |
| 24 | 2.43 | 2.0416 | -291737.53 | -10.2644 | -1.6684 | 5.468 | 34.14 | 0.3268 | 0.8271 |
| 25 | 1.893 | 5.0365 | -345632.93 | -9.0559 | -1.509 | 5.8623 | 47.28 | 0.3752 | 0.9497 |
| 26 | 2.368 | 5.3418 | -382822.84 | -9.0674 | -1.5019 | 6.3454 | 47.28 | 0.112 | 0.2834 |
logP (o/w): Log octanal/water partition coefficient, DM: Dipole Moment, EELE: Electrostatic Interactions, LUMO: Lowest Unoccupied Molecular Orbital, HOMO: Highest Unoccupied Molecular Orbital, MR: Molecular Refractivity, TPSA: Topological Polar Surface Area, pMIC: Experimentally calculated log MIC, $PRED, $RES and $Z-SCORE: Predicted pMIC, residual and Z-score values.
Table 3: Molecular descriptors, experimental and predicted PIC50 (μM) values of 26 naphthoquinone derivatives on QSAR study
| S. No. | C | V | U | R | Field |
|---|---|---|---|---|---|
| 1 | 0.88999 | 0.56345 | 0.60034 | 0.04106 | AM1_dipole |
| 2 | 0.89733 | 0.58689 | 0.62631 | 0.10835 | AM1_Eele |
| 3 | 0.88778 | 0.55682 | 0.57275 | 0.07167 | AM1_HOMO |
| 4 | 0.91107 | 0.63798 | 0.66639 | 0.39767 | AM1_LUMO |
| 5 | 0.85895 | 0.48424 | 0.48087 | 0.00009 | logP(o/w) |
| 6 | 0.88962 | 0.56232 | 0.58463 | 0.13165 | mr |
| 7 | 0.89103 | 0.56663 | 0.57166 | 0.25166 | TPSA |
| 8 | 0.88976 | 0.56273 | 0.60317 | 0.10835 | $PRED |
| 9 | 0.91636 | 0.66076 | 0.73938 | 0.89165 | $RES |
| 10 | 0.88723 | 0.55517 | 0.61793 | 0.00411 | $Z-SCORE |
| 11 | 0.86317 | 0.4935 | 0.54812 | 0.0082 | $XPRED |
| 12 | 0.91619 | 0.65997 | 0.73882 | 0.89665 | $XRES |
| 13 | 0.90532 | 0.61531 | 0.62016 | 0.01249 | $XZ-SCORE |
C: Contingency Coefficient (above 0.6 is useful); V: Cramer's V (above 0.2 is useful); U: Entropic Uncertainty (above 0.2 is useful); R: Linear Correlation (above 0.2 is useful)
Table 4: QSAR contingency analysis (database fields and suggested descriptors for QSAR)
Linear correlation graph of experimentally measured pIC50 values of training set of 26 compounds against HT-29 cell. The linearity of QSAR model was shown with error value (RMSE) and correlation actor (R2).
The Predicted activity of newly designed NQ derivatives
Using the trainpred fit file obtained from the above training set QSAR model, we can evaluate the predicted pIC50 values for the test set containing 20 compounds i.e. for the newly designed NQ derivatives. These new molecules were digitized, optimized and aligned using the same methodology described for the experimental QSAR analysis, and found that these were showed an improved theoretical anti-cancer activity against HT-29 cells and the predicted activity were represented in Table 5. However, from this QSAR study, the newly designed 20 compounds were shown a better activity as compared with the reported pIC50 values except for the compound no L14, which does not show any biological activity. It may be due to the presence of indoline moiety with this structure, where the more electronegative two oxygen atoms are present at nearby position at 2, 3 of indoline ring, while in compound no L12 contains an isoindoline ring instead of indoline ring, where the two oxygen atom present at position 1 and 4 of isoindoline ring and showed a better activity when compared to the reported experimental data.
| Compound | pIC50 Predicted | Compound | pIC50 Predicted |
|---|---|---|---|
| L1 | 5.0306 | L 11 | 4.7917 |
| L 2 | 5.2199 | L 12 | 5.0924 |
| L 3 | 5.0878 | L 13 | 5.2025 |
| L 4 | 4.857 | L 14 | - |
| L 5 | 5.0471 | L 15 | 5.0696 |
| L 6 | 4.7691 | L 16 | 5.0925 |
| L 7 | 5.1943 | L 17 | 4.9788 |
| L 8 | 4.8432 | L 18 | 4.8949 |
| L 9 | 5.1869 | L 19 | 5.0885 |
| L 10 | 5.2531 | L 20 | 5.0041 |
Table 5: Predicted cytotoxic activity for the newly designed structures using the QSAR model
Conclusion
A cross-validated correlation coefficient (r2) value is 0.1084 and root mean square error value is 0.3951. Moreover, all the compounds showed significant $Z-scores and lies within the limit. The result of principal component analysis and contingency analysis showed the selected training set for QSAR study was good and all are within the standard limit as suggested in the literature. The QSAR studies on these compounds have been shown that the predicted pIC50 values of the compounds have an acceptable correlation with the experimental values from the generated regression, principal component analysis (PCA) plots and from the contingency analysis.
Quantitative structure activity relationship studies revealed that the anticancer activities of these NQ derivatives against the cancer cell are mainly governed by log P value, dipole moment, HOMO, LUMO, the molar refractivity, and a steric parameter. Thus a proper substitution of the group on quinine ring probably improves the effectiveness of these derivatives as anticancer agents. In conclusion, QSAR model generated from the present study should be useful for designing the similar group of more potent substituted compounds with nitrogen, sulphur and oxygen atoms as promising anticancer agents. However, from this QSAR study, the newly designed 20 compounds were shown a better activity as compared with the reported IC50 values except for the compound no L14, which contains an indoline ring with two electronegative oxygen atoms at position 2 and 3 of indoline ring structure and did not show any biological activity.
References
- L.F. Liu, Annu. Rev. Biochem., 1989, 58, 351-375.
- N. Boonyalai, P. Sittikul, N. Pradidphol, N. Kongkathip, Biomed. Pharmacothera., 2013, 67, 122-128.
- J.M. Berger, J.C. Wang, Curr. Opin. Struc. Biol., 1996, 6, 84-90.
- D.S. Gilmour, S.C. Elgin, Mol. Cell. Biol., 1987, 7(1), 141-148.
- H. Zhang, J.C. Wang, L.F. Liu, Proc. Natl. Acad. Sci., 1988, 85(4), 1060-1064.
- L. Yang, M.S. Wold, J.J. Li, T.J. Kelly, L.F. Liu, Proc. Natl. Acad. Sci., 1987, 84(4), 950-954.
- S. DiNardo, K. Voelkel, R. Sternglanz, Proc. Natl. Acad. Sci., 1984, 81(9), 2616–2620.
- C. Holm, T. Goto, J.C. Wang, D. Botstein, Cell., 1985, 41(2), 553-563.
- T. Uemura, M. Yanagida, Embo J., 1984, 3 (8), 1737-1744.
- D.N. Pelageev, S.A. Dyshlovoy, N.D. Pokhilo, V.A. Denisenko, K.L. Borisova, G.K. Amsberg, C. Bokemeyer, S.N. Fedorov, F. Honecker, V.P. Anufriev, Eur. J. Med. Chem., 2014, 77, 139-144.
- J. Cadet, J.R. Wagner, Arch. Biochem. Biophys., 2014, 557, 47-54.
- R.P. Verma, Anticancer Agents Med. Chem., 2006, 6, 489-499.
- S.L. De Castro, F.S. Emery, E.N. Silva Júnior, Eur. J. Med. Chem., 2013, 69, 678-700.
- J.R.G. Castellanos, J.M. Prieto, M. Heinrich, J. Ethnopharmacol., 2009, 121, 1-13.
- M. Delarmelina, R.D. Daltoé, M.F. Cerri, K.P. Madeira, L.B. A. Rangel, V. Lacerda Júnior, W. Romão, A.G. Tarantod, S.J. Greco, J. Braz. Chem. Soc., 2015, 26 (9), S1-S20.
- R.K. Zee-Cheng, C.C. Cheng, J. Pharm. Sci., 1982, 71, 708-709.
- R.K. Zee-Cheng, A.E. Mathew, P.L. Xu, R.V. Northcutt, C.C. Cheng, J. Med. Chem., 1987, 30, 1682-1686.
- S. Petersen, W. Gauss, H. Kiehne, L. Juhling, Z. Krebsforsch., 1969, 72, 162-175.
- R.F. Silver, H.L. Holmes, Canadian J. Chem., 1968, 46, 1859.
- J. Acuña, J. Piermattey, D. Caro, S. Bannwitz, L. Barrios, J. López, Y. Ocampo, R. Vivas-Reyes, F. Aristizábal, R. Gaitán, K. Müller, L. Franco, Molecules., 2018, 23, 186.
- H. Corwin, F. Toshio, J. Am. Chem. Soc., 1964, 86 (8), 1616-1626.
- P. Sivaprakasam, A. Xiea, R.J. Doerksen, Bioorg. Med. Chem., 2006, 14, 8210-8218.
- M.C. Sharma, D.V. Kohli, S. C. Chaturvedi, S. Smita, J. Nanomat. Biostruc., 2009, 4 (4), 843-856.
- Molecular Operating Environment (MOE), Chemical Computing Group Inc., Sherbooke St. West, Suite #910, Montreal, QC, Canada, 2011, 1010 H3A 2R7.
- M.B. Tirumalasetty, S.R. Sivarathri, V.B. Baki, D. Savita, R. Aluru, S. Thirunavakkarasu, R. Wudayagiri, The Royal Soc. Chem., 2017, 7, 18277-18292.

