Research Article - Der Pharma Chemica ( 2021) Volume 13, Issue 6
Quantitative Determination of Esculetin by HPTLC in the Ethanolic Leaf Extract of C. Intybus Linn
Rajkumari1*, Meenakshi Sharma1 and Vidhu Aeri22Department of Pharmacognosy, School of Pharmaceutical Education & Research, JamiaHamdard (Hamdard University), Dr. Ambedkar Nagar, New Delhi, India
Dr. Rajkumari, Department of Pharmacognosy, I.T.S College of Pharmacy, Delhi –Meerut Road, Murad Nagar Ghaziabad, Uttar Pradesh, India, Email: rajkataria80@gmail.com
Received: 19-May-2021 Accepted Date: Jun 10, 2021 ; Published: 24-Jun-2021
Abstract
High-performance thin-layer chromatography addresses a more proficient type of ordinary TLC wherein applying, examining, and representation the spots of samples are completely automatic. Taking everything into account, HPTLC is one of the least complex, minimal expense, flexible, and explicit strategies that can be applied for the verification of food supplements including medicinal plant materials. Esculetin, chemically known as 6,7-dihydroxy coumarin, is one of the ingredients of the traditional medicinal plant Cichoriumintybus Linn. In the current investigation, a simple HPTLC method was developed and validated for the separation and quantification of esculetin in the ethanolic leaf extracts of CichoriumintybusLinn., via HPTLC. Precoated silica gel 60 F254 was used as stationary phase and toluene: ethyl acetate: formic acid in the ratio of 9.5:8.5:2 v/v as mobile phase. The plate was scanned and quantified at 356 nm for esculetin and the method was validated in terms of linearity, accuracy, and specificity. The proposed HPTLC method gives a quicker and cost-effective control for regular analysis of esculetin in the ethanolic extracts of the plant containing coumarins.
Keywords
HPTLC, esculetin, ethanolic extract, linearity, accuracy, specificity
Introduction
The advanced HPTLC technique, coupled with computerized test application and densitometric scanning, is fine and appropriate for use in qualitative and quantitative examination. HPTLC is a significant gadget for reliable outcomes since it can give chromatographic fingerprints that can be imaged and put away as automated pictures. Extraordinary benefits of HPTLC incorporate high example throughput and minimal expense per investigation; various test samples and standard samples can be separated simultaneously [1,2].
Cichoriumintybus Linn. is one of the important traditional medicinal plants belongs to the family Compositae utilized as the primary part of different formulations such as Geriforate, Acilvan, Livex [3]. Chicory is an erect glandular biennial herb with a tuberous taproot and rosette of 30-70 leaves. The stem grows up to 90cm in height; the lower leaves are larger, pinnately lobed, and covered with hairs [4]. This plant is distributed in the temperate parts of the world and found in the various state of India as a wild plant-like in Andhra Pradesh regions and Punjab regions [5]. In the Indian traditional system, it is used in the treatment of heart disease, inflammation, digestion problem, liver problem, and blood pressure [6]. This plant is used to promote appetite and digestion, as it contains different varieties of metabolites for instance bitter-testing sesquiterpene lactones, coumarins, phenylacetic acid esters, cichoriosides, sonchudides A, ixerisoside, magnolia like and endesmanolides [7,8]. Esculetin is a characteristic coumarin that has been represented to have anti‐allergic and anti‐inflammatory impacts. Esculetin smothered histamine‐induced creation of provocative cytokines and mucin in HNEpCs, which were part of the way intervened by the restraint of NF‐κB pathway due to this esculetin may be used in the treatment of Allergic rhinitis [9]. C. intybus is one of the important top-quality crops for future genetic manipulation and valuable metabolites may prompt metabolic engineering of secondary pathways [10]. In this study, a simple HPTLC method was developed and validated for the separation and quantification of esculetin in the ethanolic leaf extracts of C. intybus Linn., via HPTLC.
Materials and Methods
Chemicals
All chemicals like methanol, ethanol, toluene, ethyl acetate and formic acid used were of AR grade from S.D. fine chemicals moreover standard esculetin sample was procured from Sigma Aldrich.
Plant Material
Biological Source: Cichoriumintybus Linn.
Family: Compositae
Part used: Leaves
Place of collection: Herbal garden of JamiaHamdard, New Delhi
Identified by: Taxonomist, Department of Botany, Faculty of Science, JamiaHamdard
Voucher specimen no. : PRL/JH/05/28
TLC plate, Instruments, and Software
Silica gel 60 F (254) precoated Aluminium foil plates with thickness 0.2 mm (1.0554, Merck), HPTLC instrument (Camag, Switzerland) consist of TLC Scanner III, application device Linomat V, twin trough TLC plate development glass chamber and win cats software were used.
Sample solution preparation
About 10 gm of dried leaves powder of C.intybus was accurately weighed and refluxed with ethanol (250 ml) for 3hr on the water bath and filtered through Whatman filter paper No. 41. The marc left out was refluxed again with ethanol (250 ml) for 3hr and filtered. The filtrate was combined; color impurities were removed by treating with activated charcoal after that the filtrate was concentrated to 25 ml in a rotary vacuum evaporator and the resulting solutions were used as test sample solutions. The ethanolic extract thus obtained was dried under reduced pressure at room temperature not exceeding 40°C. About 100 mg of extract was dissolved in 10 ml of ethanol, sonicated, and filtered through a membrane filter.
Standard solution preparation
Standard stock solution (1000 μg/10 ml) of esculetin was prepared by weighing 10 mg of 98.00% esculetin, transferring to 10 ml volumetric flask respectively, dissolving in a minimum quantity of ethanol and sonicated in the ultrasonic water bath to dissolve and volume was made up to 10 ml with the same solvent. Then 1 ml of standard stock solution was taken from the volumetric flask and diluted to 10 ml with ethanol. The resulting solution was used as a reference solution for esculetin.
Chromatographic Conditions
Parameters with the specifications were maintained and used for the quantitative determination of esculetin, as given in Table 1
| S.No. | Parameters | Specification |
|---|---|---|
| 1 | Stationary phase | Silica gel 60 F 254 (E. Merck) precoated TLC plates |
| 2 | Mobile phase | Toluene: Ethyl acetate: Formic acid (9.5:8.5:2 v/v) |
| 3 | Sample volume to be injected | 2 µl |
| 4 | Photodocumentation by Reprostar at | 356 nm |
| 5 | Detection by Scanner | 366 and 254nm |
| 6 | Temperature | Ambient room temperatue |
| 7 | Migration distance | 8cm |
| 8 | Detection wavelength | 356 nm |
Procedure
The precoated TLC plates were pre-washed with methanol; Standard and test sample solutions were prepared and applied to the plate as sharp bands using Camag Linomat V sample applicator; TLC plates were air-dried at room temperature. Mobile phase (20 ml) was poured into twin trough glass chamber, the whole assembly was left to saturate for 30 min and the plate was placed in the chamber. The plate was then developed until the solvent front had traveled at a distance of 80 mm above the base of the plate. The plate was air-dried after removing from the twin trough glass chamber. Detection and quantification of esculetin were performed with Camag TLC Scanner 3 at a wavelength of 356 nm.
Assay
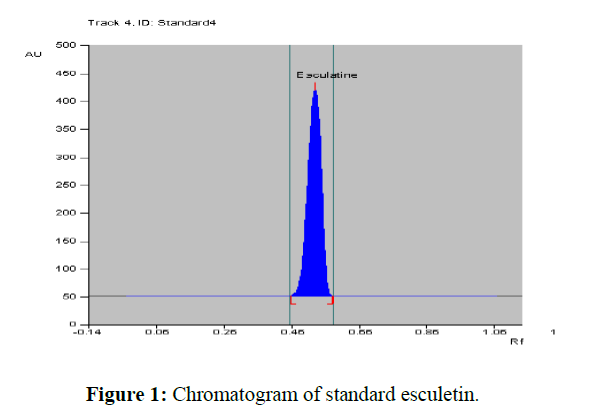
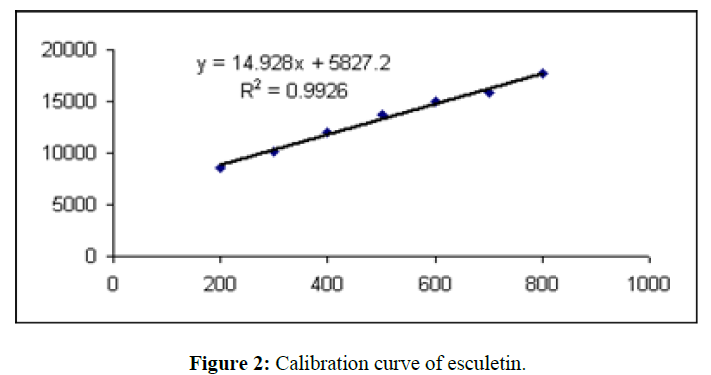
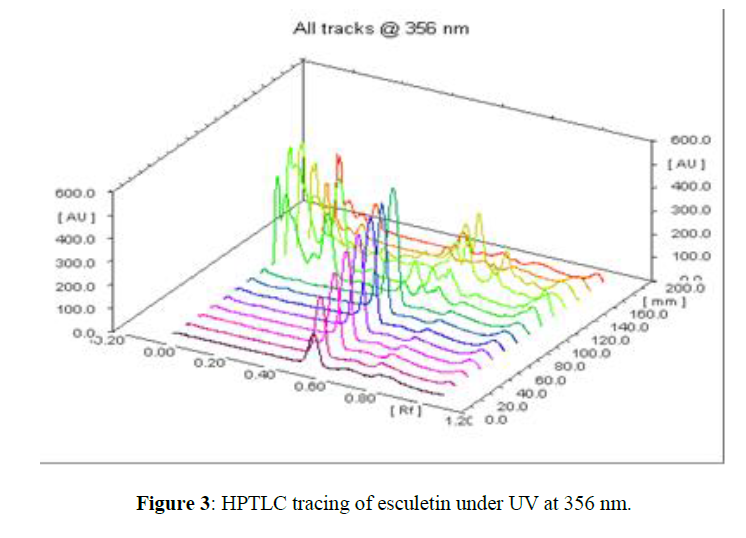
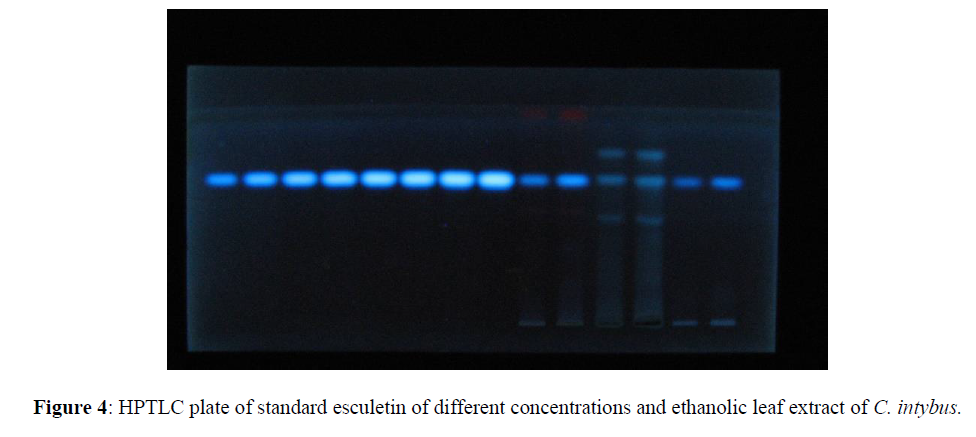
Standard and test sample solutions were spotted on an HPTLC plate (E. Merck). The percentage of esculetin presents an ethanolic leaf extract of C. Intybus was calculated by comparison of the areas measured for the sample and standard solutions; [Figures 1-4] represent the chromatograms of standard esculetin and test samples.
Linearity
Linearity was performed by applying standard solution at different concentrations ranging from 8 to 40 µg/spot on 20 × 10 cm HPTLC plates, precoated with silica gel 60 F254 (E. Merck) in the form of sharp 6 mm bands; the distance between two adjacent bands was 10 mm. The plates were developed in a 20 ml mobile phase of toluene: ethyl acetate: formic acid (9.5:8.5:2 v/v), up to a distance of 80 mm, at room temperature then plates were dried in air. The detector response for esculetin was measured for each band at the wavelength of 356 nm, using Camag TLC Scanner 3 and win CAT software. The peak areas of esculetin were recorded for each concentration. The linearity curve of esculetin was obtained by plotting a graph of peak area of esculetinvs applied concentration of esculetin (µg).
Method Validation
The method was validated [11] for precision, repeatability, and accuracy. The precision was checked by repeated scanning of the same spot of esculetin (20.2µg) three times each and was expressed as relative standard deviation (% RSD). The repeatability of the method was confirmed by analyzing 16 µg and 20.2 µg/spot of standard esculetin solution (n=3) and was expressed as % RSD. The precision of the method was studied by analyzing aliquots of a standard solution of esculetin (16 µg and 20.2 µg/spot) on the same day (intra-day precision) and different days (inter-day precision) and the results were expressed as % RSD.
To study the accuracy, the recovery experiment was performed by the method of standard addition. The recovery of the added amount of standard was analyzed at three different levels, each being analyzed like that described for assay. Each level of addition was repeated three times on three different days and recovery of the added amount of standard was calculated. The limit of detection and the limit of quantification was also calculated by the proposed method.
Result and Discussion
The method described utilizes silica gel 60 F 254 HPTLC plates as stationary phase and toluene: ethyl acetate: formic acid (9.5:8.5:2 v/v) as a mobile phase which gives good separation of esculetin (Rf= 0.57). The results of method validation parameters are shown in (Table 2). The identity of the band of esculetin in the sample extracts was confirmed by overlaying the UV absorption spectra of a sample with that of reference standard which showed λmax at 356 nm (Figure 3). The calibration curve was linear in the range of 8 µg to 40 µg/spot and the correlation coefficient was determined. The correlation coefficient was found to be 0.99260. The limit of quantification was found to be 9.9 µg and the limit of detection was 2.5 µg/spot. The method was validated in terms of precision and reproducibility expressed as % RSD which were found to be less than 2%. The recovery values obtained were 97.50 to 100.05 %, showing the accuracy of the method. The average percentage recovery was found to be 99.26%.
| S.No. | Parameters | Result |
|---|---|---|
| 1 | Precision (% RSD) | < 2% |
| 2 | Linearity | 8 – 40 µg/ spot |
| 3 | Limit of Detection (LOD) | 2 µg/ spot |
| 4 | Limit of Quantification (LOQ) | 9.7 µg/ spot |
| 5 | Accuracy | 97.50 – 100.05 % |
| 6 | Assay | 40.2 % w/w |
Conclusion
The developed HPTLC method was simple accurate, precise, economic and can be utilized for routine analysis and quantitative determination of esculetin from Cichoriumintybus.
References
- El-Ahmady SH, Ashour ML. Advances in food authenticity testing, 2016. 1: p. 667
- Manmohan Srivastava S. Springer Book, 2014. p. 203
- Rasheeduz Z and Ali S. Mujahid. J Ethanopharmacology,1998. 63: p. 227.
- Ahmed B, Tawfeq A, Howiriny A et al., J Ethnopharmacol, 2003. 87: p. 237.
- Prajapati DS, Purohit SS, Sharma KA et al., Handbook of Medicinal Plants a Complete Source Book, 2003. p. 139.
- Anonymous, Council of Scientific and Industrial Research, 1992. 3: p. 556.
- Kisiel W and Zielin´ska K. Phytochemistry, 2001. 57: p. 523.
- Janusz Malarz, Anna Stojakowska, Wanda Kisiel et al., J Biosci, 2002. 5: p. 994.
- Bin sun, Botaowang, Min Xu. Clin Exp Pharmacol Physiol, 2019. 18: p. 821.
- Bais HP and Ravishankar GA, J Sci Food Agri, 2001.81: p. 467.
- ICH Topic Q2B., Validation of analytic procedures: Methodology. London.1996.


