Research Article - Der Pharma Chemica ( 2018) Volume 10, Issue 3
Novel Ultra High Performance Liquid Chromatographic Study for Simultaneous Determination of Canagliflozin and Metformin in Binary Mixtures
Wafaa A Zaghary1, Shereen Mowaka2,3,4 and Moataz S Hendy2,4*
1Pharmaceutical Chemistry Department, Faculty of Pharmacy, Helwan University, Ein Helwan, Cairo 11795, Egypt
2Pharmaceutical Chemistry Department, Faculty of Pharmacy, The British University in Egypt, El-Sherouk City, Cairo 11837, Egypt
3Analytical Chemistry Department, Faculty of Pharmacy, Helwan University, Ein Helwan, Cairo 11795, Egypt
4The Center for Drug Research and Development (CDRD), Faculty of Pharmacy, The British University in Egypt, El- Sherouk City, Cairo 11837, Egypt
- *Corresponding Author:
- Moataz S Hendy
Pharmaceutical Chemistry Department
Faculty of Pharmacy
The British University in Egypt
El-Sherouk City, Cairo 11837, Egypt
Abstract
An easy, accurate, and decisive UHPLC chromatography method for determination of both Metformin (MET) HCl and Canagliflozin (CANA) together either in bulk, binary mixtures or in dosage form has been developed and validated. Analysis was operated on Symmetry® Acclaim™ RSLC 120 C18 column (100 mm, 2.1 mm, 2.2 μm) whose temperature was maintained at 60°C. Meanwhile mobile phase was potassium dihydrogen phosphate buffer pH (3.5)-acetonitrile (45:55, v/v) at flow rate of 0.4 ml.min-1. UV detection was carried out at 225 nm. Linearity, accuracy and precision were adequate and solid over 0.5-90 μg.ml-1 for Metformin hydrochloride and 1-50 μg.ml-1 for canagliflozin hemihydrate as concentration ranges for each. This method was employed productively in analysis of laboratory mixtures besides their combined brand dosage form. Statistical comparison with reported technique gives no significant divergence in veracity and precision. The directness and sensitivity of the method empower its use in day-to-day quality control experiments.
Keywords
Canagliflozin, GLT2 inhibitors, Invokamet
Introduction
Canagliflozin (CANA), (2S, 3R, 4R, 5S, 6R)-2-{3-[5-[4-Fluoro-phenyl)-thiophen-2-ylmethyl]-4- methyl-phenyl}-6-hydroxymethyl-tetrahydropyran- 3,4,5-triol, act as suppressor for sodium glucose co transporter 2 (SGLT-2). This suppression result in nearly 90% stoppage of glucose reuptake into the blood during its excretion (Figure 1a) [1].
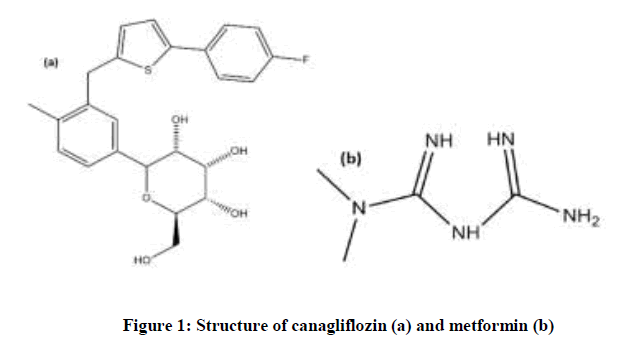
Figure 1: Structure of canagliflozin (a) and metformin (b)
Metformin hydrochloride (MET), N,N-dimethylimidodicarbonimidic diamide, is a biguanide antihyperglycemic agent which gives its outcome upon raising glucose metabolism in peripheries (Figure 1b) [2].
Referring to the literature review; sparse methods were proclaimed [3,4], for concentration assurance of CANA and MET together in pharmaceutical preparations or in laboratory prepared mixtures. Other few methods were found for determination of CANA alone, either in dosage form [5-7] or in plasma [8,9]. On the contrary, various analysis methodologies were developed for investigation of MET using both spectrophotometry and chromatographic techniques [10-32]. The presented UHPLC method aims to be the first method for concurrent identification and quantification of MET and CANA in bulk and in pharmaceutical dosage form utilizing UHPLC with UV detection.
M. Iqbal et al. [8,9] have performed UHPLC method for detection of CANA in plasma using MS/MS and fluorescence detectors each in a separate study. However the low limit of detection and quantification reported, mass or fluorescence detectors are considered quiet expensive and less notorious; they may not be used as regular method in quality control laboratories. It’s worthy to mention the difference in scope between the reported UHPLC methods and this proposed UHPLC-UV method. Those methods were aiming to achieve detection in plasma that in turn need a higher level of sensitivity, while this UHPLC-UV was driven to perform regular quality supervision of drug in raw or in tablet dosage form. Not to mention, UV detectors are the most widely used and found in analytical chemistry laboratories. It’s not easy to find UPLC with MS/MS facilities in developing countries laboratories. The achieved UHPLC-UV method has many pros over the ordinary HPLC methods that was previously published for CANA and MET [7,9]. Budget wise an UHPLC method is much more preferable as it is more fiscal; it consumed less mobile phase over shorter periods. Moreover, upon comparison with other reported methods, this proposed method reveals major advantages in terms of shorter retention times, superior sensitivity, boosted resolution and simpler mobile phase with lower buffer percentage, as shown in Table 1.
| Methods | Column | Mobile phase | Run time (min) | Sensitivity |
|---|---|---|---|---|
| Reported method [3] | C18 column ambient temperature | Ammonium acetate: Acetonitrile (ph 3.5) (65:35, v/v) |
8 min | CANA (5-30 μg.ml-1) MET (50-300 μg.ml-1) |
| Reported method [4] | C18 column temperature 30°C | Phosphate buffer: Acetonitrile (ph 4.5) (65:35, v/v) |
4 min | CANA (5-30 μg.ml-1) MET (50-300 μg.ml-1) |
| Proposed method | C18 column temperature 60°C | Phosphate buffer: Acetonitrile (ph 3.5) (45 : 55, v/v) |
3 min | CANA (1-50 μg.ml-1) MET (0.5-90 μg.ml-1) |
Table 1: Comparative study between different LC-UV reported methods and the proposed method
The proposed experiment
Instruments
The wielded Liquid chromatography facility was a Thermo Fisher UPLC. Its model is Ultimate 3000-Complete Ultra Performance Liquid Chromatography (USA). Separation was done on Symmetry® Acclaim™ C18 column with dimensions (100 mm, 2.1 mm, 2.2 μm) (USA). Diode Array UV Detector (DAD-3000 RS, USA) and an autosampler (WPS-3000TRS, Thermo Scientific USA) was employed. Solvent degassing was utilized using Elmasonic S 60 H water bath sonicator (Germany). To adjust pH; Jenway digital pH meter, UK was used.
Reagents and samples
High grades of canagliflozin powder guaranteed to contain 99.90% of pure raw material drug purchased from BaoJi Guokang Bio-technology co., Ltd. Metformin hydrochloride, certified to have 99.88% of the active material of the drug, was kindly granted from ‘Chemical Industries Development’ (CID) Co. (Egypt). Invokamet® tablet contains 1000 mg MET and 50 mg CANA was obtained from local market. HPLC grade methanol, acetonitrile and Orthophosphoric acid (85%) were obtained from Fisher Scientific (Loughborough, Leicestershire, UK). Ultrapure grade of potassium phosphate monobasic was bought from Sigma Aldrich (Deisenhofen, Germany). Deionized and distilled water were provided in laboratory. Mobile phase was filtered through PTFE membrane filters (UK) with diameter 47 mm and pore size of 0.20 mm. Chemicals of analytical laboratory grade was used unless marked differently.
Chromatographic conditions
Separation was carried out using a Symmetry® Acclaim™ C18 column (100 mm, 2.1 mm, 2.2 μm) via isocratic elution. Potassium phosphate monobasic as buffer (0.03 M) with pH (3.5) and acetonitrile in (45:55, v/v) ratio was prepared as mobile phase. 225 nm was elected for determination of both CANA and MET. After preparation of buffer, it was filtered using a 0.2 mm membrane filter then degassing for 20 minutes. The pump was adjusted to deliver mobile phase with 0.4 ml.min-1 flow rate through stationary phase. Temperature of column oven was maintained at 60°C. Autosampler injected 10 microliter of each sample each time.
Procedures
Preparation of calibration standards
Stock of CANA and MET with concentration of 1 mg.ml-1 were solely made in methanol. Then preparing of working solutions by dilution the analogous stock solutions with mobile phase was performed. Both working solutions and initial stocks were stored at 4°C in refrigerator and shed within 30 days.
Calibration curves development
Aliquots equivalent to 5-900 μg MET and 10-500 μg were separately and precisely pipetted from their stock and working solutions into 10 ml volumetric flask. Volumes were completed to the final mark using mobile phase; KH2PO4: Acetonitrile (45: 55, v/v) pH 3.5. Final ranges of concentration were: 0.5-90 μg.ml-1 for MET and 1-50 μg.ml-1 for CANA were obtained. 10 μl of each concentration was injected utilizing the mentioned conditions into the chromatographic system. Each injection is done in triplicates. Plotting the value of area under the peak obtained for each sample versus its comparable concentrations, calibration curve was obtained for each drug.
Assay of laboratory prepared mixtures
In order to prepare binary mixtures of different ratios, accurately calculated volumes of CANA and MET were properly mixed. 10 μl of each mixture were injected onto stationary phase. Percentage recoveries were then estimated by using the comparable regression equation. Application to pharmaceutical preparation Ten tablets of Invokamet® 50 CANA/1000 MET was solely weighed, powdered and blended. Specific amount of the obtained powder contains 100 mg of MET and 5 mg of CANA were dissolved in 30 ml of methanol in 100 ml flask, sonicated for 20 min. The solution was filtered and made up to mark with methanol. Then serial dilutions are done to the required concentrations using the mobile phase. This step accompanied with addition of precise calculated amount of pure drug to achieve standard addition technique. The procedure was continued as mentioned under
Calibration curves development
Percentage recoveries were then calculated by using the analogous regression equation. Due to the unavailability of the blank matrix of the studied tablets, the standard addition technique was implemented using various known concentrations of the pure drug that is added to different concentrations of drugs in marketed tablets referring to the proposed method. Precise calculation of the different concentrations was done via corresponding regression equations.
Method validation
This proposed technique validation was done in terms of linearity, accuracy, precision, specificity, limits of detection and quantification and robustness in line with recommendations and guidelines of ICH Q2 (R1) [33].
Results and Discussion
UHPLC supremacy
After exhaustive literature search and review, no techniques are found for simultaneous determination of CANA and MET in bulk or in pharmaceutical dosage forms using UHPLC with UV detection. UHPLC possess many related privileges over HPLC as that UHPLC conducts much higher pressure; this provides the advantages of enhanced peaks resolution and less solvent consumption. This better resolution is represented by superior peak shape. HPLC normally gives wide peaks that veteran users can distinguish well, not to mention peak heights and peak widths. Other essential advantages are much shorter chromatogram time and a notable cutback in solvent usage. In sum, UHPLC drives greater resolution paired with higher output of whole analysis technique, lower solvent consumption, and subsequently reduced the overall costs.
Chromatographic method development
During the method development many stationary phases were tried yet the C18 column gave the finest results with desirable sharp peaks with improved resolution, satisfying peak intensity and great output separation. Various mobile phases, with diverse amount of organic and watery phases were subsequently tried with isocratic elution. Methanol and acetonitrile with water in various ratios was tried as a simple phase, yet no good separation acquired. Over trials, acetonitrile was found to give the ideal separation. Additionally, usage of different buffers with different molarities at differing pH was tried with acetonitrile. Starting with acetate buffer then phosphate with 2 molarities (0.03 and 0.05 M) it was found that buffer of choice was phosphate buffer with 0.03M concentration. The pH of the used phosphate buffer was settled at 3.5 assuring that pH should be lower than the pKa of the investigated drugs, as the pKa of CANA is 12.6 and the pKa of MET is 12.4.
Additionally, UV detection was carried out at four different values: 225 nm, 212 nm, 240 nm and 245 nm. Those were selected via comparing the UV spectrums of the studied drugs. 225 nm was then chosen since; it gave better sensitivity and best resolution for simultaneous determination of both drugs. Solution of Phosphate as a buffer gave the most convenient conditions at the selected wavelength rather other buffers like acetate. Also, 0.4 ml.min-1 as flow rate was imperative to augment the resolution between the two peaks as depicted in Figure 2.
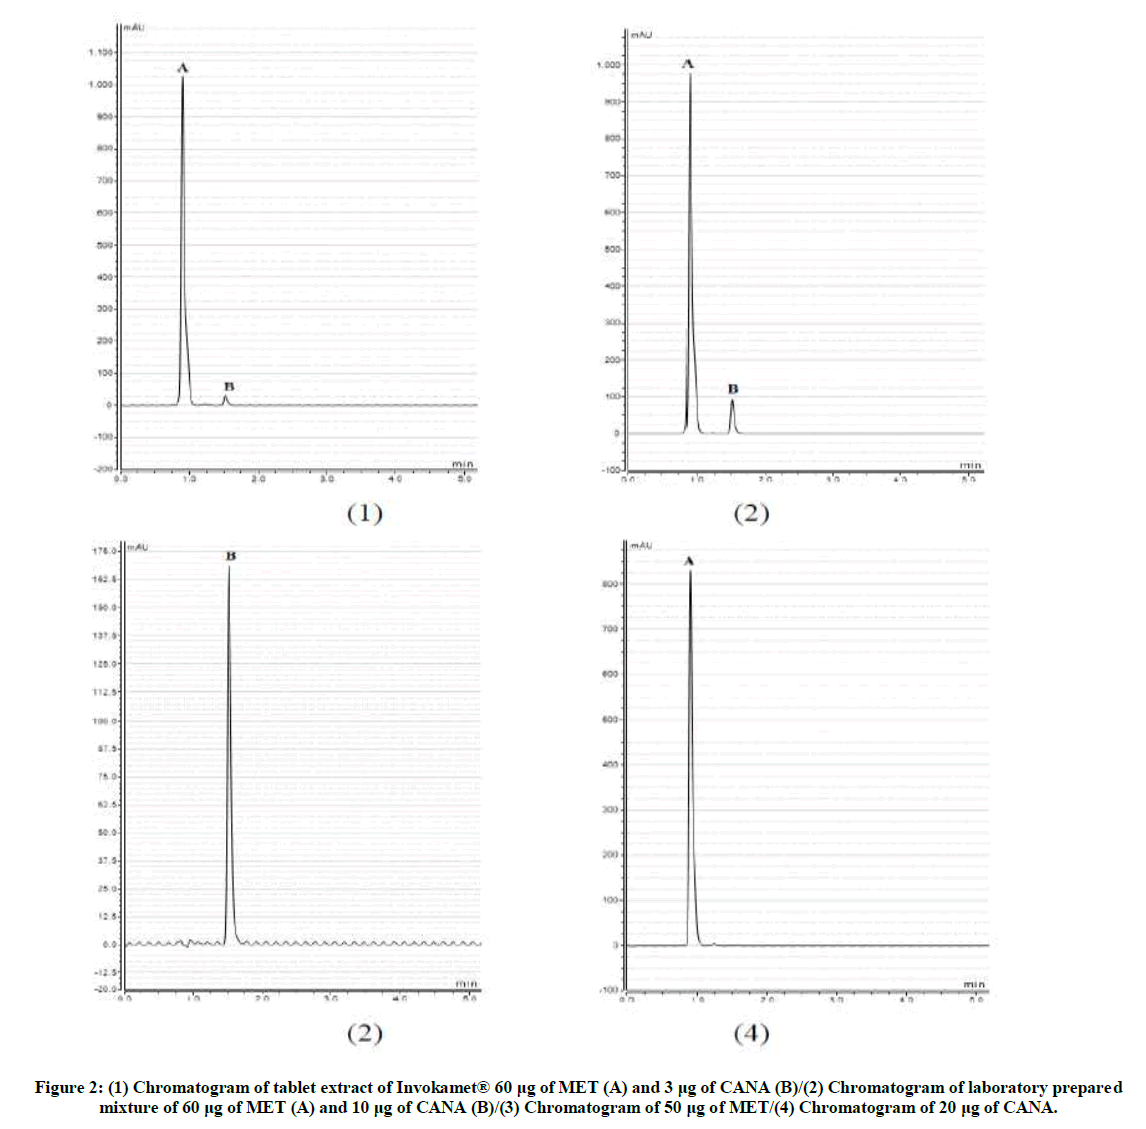
Figure 2: (1) Chromatogram of tablet extract of Invokamet® 60 μg of MET (A) and 3 μg of CANA (B)/(2) Chromatogram of laboratory prepared mixture of 60 μg of MET (A) and 10 μg of CANA (B)/(3) Chromatogram of 50 μg of MET/(4) Chromatogram of 20 μg of CANA.
A higher flow rate led to a higher back pressure in UHPLC pump of more than 400 bar that in turn is not agreeable. Column temperature was set to be 60°C, which in turn result in better peak symmetry with no tailing and lower baseline noise. Meanwhile, the two drugs showed no degradation effect as a result of column heating.
System suitability tests
Equally essential, is to certify that resolution, detection sensitivity and reproducibility of chromatographic separation are satisfactory; therefore system suitability tests were implemented for this studied method according to USP [34]. The resolution factor represents the exactness of the analysis; it is specified to assure that drugs eluted through column are well separated. In order to detect trace compounds, peak sharpness need to be measured by detection of column efficiency which is a system suitability requirement. While measuring the peak symmetry is done by determination of the tailing factor. Studying of other parameters directly affect the chromatographic separation are essential, these include the column competence (efficiency) which is determined by calculating number of theoretical plates, peak tailing, resolution factor of the peak, peak area percentage RSD and retention time. All are shown in Table 2.
| Parameters | CANA | MET | Reference Value |
|---|---|---|---|
| Retention time (tR) | 1.5 | 0.8 | -- |
| Resolution (Rs) | 2.8 | > 1.5 | |
| Selectivity Factor (α) | 0.5 | > 1 | |
| Capacity Factor (K’) | 14 | 7 | > 1 |
| Number of theoretical plates (N) | 1417 | 1296 | > 2000 |
| Height Equivalent of the Theoretical Plates (HETP) | 0.007 | 0.008 | The smaller the value the higher the column efficiency |
Table 2: System suitability parameters for the proposed method
Method validation
Method validation is done as reported in ICH (Q2) R1 guidelines [33].
Linearity
Via the optimized conditions, CANA and MET were determined by scrutinizing differing concentrations of them. The obtained peak areas are plotted against their corresponding concentrations. The relationship obtained was linear over the concentration ranges of 0.5-90 μg.ml-1 for MET and 1-50 μg.ml-1 for CANA then corresponding regression equations were obtained. Linearity was guaranteed over calibration by the immense values of correlation coefficient, agreeable numbers of regression coefficients. Besides the values of slope and intercept standard deviations which is pointed out in Table 3.
| Parameters | CANA | MET |
|---|---|---|
| Linearity range | 1-50 µg.ml-1 | 0.5-90 µg.ml-1 |
| Slope | 1.3010 | 1.3559 |
| Intercept | 0.4555 | 0.7413 |
| Correlation coefficient | 0.9999 | 0.9998 |
| Accuracy (Mean ± SD) | 99.71 ± 0.65 | 99.79 ± 0.51 |
| LOD | 0.74 µg.ml-1 | 0.93 µg.ml-1 |
| LOQ | 2.24 µg.ml-1 | 2.83 µg.ml-1 |
| Precision (%RSD) Repeatability intermediate precision |
0.65 0.53 |
0.51 0.63 |
| Specificity (Mean ± SD) | 99.45 ± 0.66 | 100.55 ± 0.98 |
Table 3: Regression and validation parameters for the determination of the canagliflozin and metformin by the proposed method
Accuracy
Determination of five concentrations within the linear ranges for each of MET and CANA was applied using the previously constructed regression equations. The percentage recoveries, the mean percentage recovery and the standard deviations were calculated, as shown in Table 4.
| Canagliflozin | Metformin | ||||
|---|---|---|---|---|---|
| Taken (µg.ml-1) |
Found (µg.ml-1) |
% Recovery | Taken (µg.ml-1) |
Found (µg.ml-1) |
% Recovery |
| 7 | 6.93 | 99.01 | 30 | 30.18 | 100.60 |
| 12 | 12.02 | 100.13 | 15 | 14.88 | 99.19 |
| 17 | 16.85 | 99.10 | 25 | 24.92 | 99.69 |
| 30 | 30.15 | 100.51 | 35 | 34.92 | 99.78 |
| 40 | 39.92 | 99.81 | 45 | 44.88 | 99.73 |
| Mean ± SD | 99.71 ± 0.65 | Mean ± SD | 99.79 ± 0.51 | ||
Table 4: Accuracy of the proposed method for determination of canagliflozin and metformin in their pure form
Precision repeatability
Three freshly prepared solutions of 5, 10, 15 μg.ml-1 for MET and 10, 20, 40 μg.ml-1 for CANA were analyzed in triplicate three times intraday using the same chromatographic conditions and linearity regression equations. %RSD was then calculated as specified in Table 3.
Intermediate precision
The previous concentrations of MET and CANA mentioned under repeatability were analyzed in triplicates for three ensuing days utilizing the procedure mentioned under linearity then %RSD was then calculated (Table 3).
Specificity
Concentrations of the prepared solutions of laboratory mixtures, contains certain amounts of CANA and MET with differing ratios (One of them is 1: 20 as that of the studied dosage form) were determined by using the suggested method assuring its specificity. Calculations of percentage recovery, the mean percentage recovery and the standard deviations were obtained as in Table 5 and Figure 2.
| Mix. No | CANA | MET | CANA | MET | ||
|---|---|---|---|---|---|---|
| Taken (µg/ml) | Found (µg/ml) | % Recovery | Found (µg/ml) | % Recovery | ||
| 1 | 8 | 70 | 7.92 | 99.00 | 70.51 | 100.73 |
| 2 | 10 | 65 | 9.87 | 98.70 | 65.58 | 100.89 |
| 3 | 20 | 80 | 20.06 | 100.30 | 81.2 | 101.50 |
| 4 | 25 | 65 | 24.99 | 99.96 | 65.47 | 100.72 |
| 5* | 3 | 60 | 2.98 | 99.33 | 59.34 | 98.90 |
| Mean ± SD | 99.45 ± 0.66 | 100.55 ± 0.98 | ||||
*Laboratory mixture represents the CANA: MET ratio as 1:20 as that of the analysed dosage form
Table 5: Determination of canagliflozin and metformin in laboratory prepared mixtures by the proposed UHPLC method
Robustness
Robustness is verified by changing slightly some parameters of the chromatographic conditions with no effect on the resolution factor (R) within two adjacent peaks (CANA and MET). The flow rate was changed by ± 0.1 ml.min-1. The wavelength was altered ± 2 nm, while the pH was changed by ± 0.2 unites. It was found that the suggested method is robust against these changes (Table 6).
| Resolution factor (R) | ||
|---|---|---|
| CANA | MET | |
| Flow rate (ml.min-1) | ||
| 0.3 | 2.89 | |
| 0.4 | 2.8 | |
| 0.5 | 2.4 | |
| pH of buffer | ||
| 3.3 | 2.7 | |
| 3.5 | 2.8 | |
| 3.7 | 2.9 | |
| Wavelength (nm) | ||
| 222 | 2.5 | |
| 225 | 2.8 | |
| 227 | 2.6 | |
Table 6: Study of robustness of the proposed UHPLC-UV method for the determination of canagliflozin and metformin
Application on tablet dosage form implementing standard addition technique
The procedure mentioned under “2.4.4.” was applied on the studied dosage form. The concentration is calculated through the corresponding regression equations then the percentage recoveries, the mean percentage recovery and the standard deviations were obtained. Standard addition technique was used to further assess the method and to prove that there is no interference of excipients in the pharmaceutical dosage form using the suggested method as presented in Table 7.
| Pharmaceutical Formulation |
CANA | MET | ||||||||
|---|---|---|---|---|---|---|---|---|---|---|
| Claimed (µg.ml-1) |
%found | standard addition technique | Claimed (µg.ml-1) |
%found | standard addition technique | |||||
| Pure added |
Pure Found | %Recovery | Pure added |
Pure Found | % Recovery | |||||
| Invokamet® 50 CANA/1000 MET | 3 (µg.ml-1) | 100.46 | 7 | 6.91 | 98.69 | 60 (µg.ml-1) | 100.15 | 5 | 5.02 | 100.44 |
| 22 | 21.74 | 98.81 | 5 | 4.93 | 98.51 | |||||
| 17 | 17.05 | 100.28 | 20 | 20.01 | 100.04 | |||||
| 5 | 4.98 | 99.60 | 10 | 10.18 | 101.82 | |||||
| Mean ± SD | 99.35 ± 0.74 | Mean ± SD | 100.20 ± 1.36 | |||||||
Table 7: Assay of canagliflozin and metformin in Invokamet® tablets and application of the standard addition technique
Statistical analysis
The obtained results for analysis of CANA and MET by this investigated UHPLC method were statistically compared to the reported methods for CANA [3] and MET [25] in terms of accuracy and precision. The values of computed t and F were lower than its tabulated values at 95% confidence level. This uncovers that there was no momentous difference concerning accuracy and precision as presented in Table 8 [35].
| Statistical term | Reference method, CANA | UHPLC method, CANA |
Reference method, MET | UHPLC method, MET |
|---|---|---|---|---|
| Mean* | 99.52 | 99.71 | 100.59 | 99.79 |
| SD ± | 0.76 | 0.65 | 0.81 | 0.51 |
| %RSD | 0.76 | 0.65 | 0.81 | 0.51 |
| N | 5 | 5 | 6 | 5 |
| V | 0.58 | 0.42 | 0.66 | 0.26 |
| t | 0.42 (2.306) | 2.097 (2.262) | ||
| F | 1.367 (6.3882) | 2.522 (6.2561) | ||
SD = Standard deviation, % RSD = Percent relative standard deviation, values in parenthesis are the theoretical values of t and F at P = 0.05 [35];
*Average of three different determinations
Table 8: Statistical comparison between the results of the proposed UPLC method and the reference method for CANA [3] and MET [25]
Conclusion
The easiness, accuracy, preciseness and reproducibility of presented UHPLC method for contemporaneous analysis and identification of CANA and MET have been comprehensively asserted. This method is adequate for analysis of CANA and MET either in bulk or in combinations of their pharmaceutical dosage form with 1:20 ratio. Shorter run time paired with great sensitivity was attained. Validation of the method further showed adequate investigation for all the parameters. Consequently, the presented UHPLC analysis technique can be efficiently employed as a quality control experiment owing to the privilege of simplicity and saving time with much lower cost.
References
- H. Bays, Curr. Med. Res. Opin., 2009, 25, 671.
- D.G. Gardner, D. Shoback, Greenspan’s Basic & Clinical Endocrinology, editors-David G. Gardner and D. Shoback, 9th Edn., McGraw-Hill Medical, New York, 2011, 17, 613-614.
- U. Panigrahy, A. Reddy, Orient. J. Chem., 2015, 31, 1489-1507.
- D. Gaware, R. Patil, M. Harole, WJPPS., 2015, 4, 631-640.
- N. Patel, D. Shah, D. Maheshwari, Int. J. Pharm. Technol., 2015, 7, 9779-9784.
- I. Kaur, S. Wakode, H. Singh, Pharm. Methods., 2015, 6, 82-86.
- A. Suneetha, D. Sharmila, RJPBCS., 2015, 6, 1186-1194.
- M. Iqbal, E, Ezzeldin, K. Al-Rashood, Y. Asiri, N. Rezk, Talanta., 2015, 132, 29-36.
- M. Iqbal, N. Khalil, A. Alanazi, K. Al-Rashood, Anal. Methods., 2015, 7, 3028-3035.
- R. Bhushan, D. Gupta, A. Jain, J. Planar Chromatogr. Mod. TLC., 2006, 19, 288-296.
- P. Sengupta, U. Bhaumik, A. Ghosh, A. Sarkar, Chromatographia., 2009, 69, 1243-1250.
- R. Elbagary, E. Elkady, B. Ayoub, Int. J. Biomed. Sci., 2011, 7, 201-208.
- M. Wang, I. Miksa, J. Chromatogr. B: Biomed. Sci. Appl., 2007, 856, 318-327.
- C. Georgita, F. Albu, V. David, A. Medvedovici, J. Chromatogr. B., 2007, 854, 211-218.
- M. Ali, S. Rafiuddin, M. Ghori, A. Khatri, Chromatographia., 2008, 67, 517-525.
- E. Lai, Feng, J. Chromatogr. B., 2006, 843, 94-99.
- R. Elbagary, E. Elkady, B. Ayoub, Talanta., 2011, 85, 673-680.
- L. Zhang, Y. Tian, Z. Zhang, Y. Chen, J. Chromatogr. B., 2007, 854, 91-98.
- A. Ali, I. Duraidi, M. Saket, E. Abu-Nameh, J. AOAC Int., 2009, 92, 119-124.
- R. Elbagary, E. Elkady, B. Ayoub, Eur. J. Chem., 2013, 4, 360-365.
- A. Ghassempour, M. Ahmadi, S. Ebrahimi, H. Aboul-Enein, Chromatographia., 2006, 64, 101-104.
- R. Elbagary, E. Elkady, B. Ayoub, Int. J. Biomed. Sci., 2011, 7, 62-69.
- K. Tahara, A. Yonemoto, Y. Yoshiyama, T. Nakamura, M. Aizawa, Y. Fujita, T. Nishikawa, Biomed. Chromatogr., 2006, 20, 1200-1205.
- S. Pawar, G. Meshram, M. Phadke, Chromatographia., 2008, 68, 1063-1066
- R. Elbagary, E. Elkady, B. Ayoub, Eur. J. Chem., 2013, 4, 444-449.
- S. Mowaka, B. Ayoub, Pharmazie., 2017, 72, 67-72.
- S. Mowaka, E. Elkady, M. Elmazar, B. Ayoub, Microchem. J., 2017, 130, 360-365.
- B. Ayoub, O. Abdel-Aziz, Pharmazie., 2016, 71, 683-690.
- B. Ayoub, RSC Adv., 2015, 5, 95703-95709.
- S. Mowaka, D. Mohamed, RSC Adv., 2015, 5, 60467-60481.
- G. Khan, D. Sahu, Y.P. Agrawal, N. Sabarwal, A. Jain, A.K. Gupta, Asian J. Biochem. Pharm. Res., 2011, 1, 352-358.
- R. Peraman, C.S. Gowra, Y.P. Reddy, K.K. Peruru, Chromatographia., 2013, 76, 1153-1162.
- ICH Harmonized Tripartite Guideline, Validation of Analytical Procedures: Text and Methodology, Q2 (R1), Current step 4 version, Parent guidelines on Methodology, 1996.
- U.S. Pharmacopeia 30 and National Formulary 25, U.S. Pharmacopoeial Convention, Inc., Rockville, MD, 2007.
- J.N. Miller, J.C. Miller, Statistics and Chemometric for Analytical Chemistry, Pearson Education Limited, England, Harlow, 5th Edn., 2005.


