Research Article - Der Pharma Chemica ( 2018) Volume 10, Issue 11
New Visible Spectrophotometric Methods for Estimation of Rabeprazole in Bulk and Pharmaceutical Formulation
Saleema Shaik, Hemant Kumar T*, Srinivasa Rao Y and Vara Prasad Rao K
Department of Pharmaceutical Analysis and Quality Assurance, Vignan Institute of Pharmaceutical Technology, Beside VSEZ, Duvvada, Visakhapatnam-530049, Andhra Pradesh, India
- *Corresponding Author:
- Hemant Kumar T
Department of Pharmaceutical Analysis and Quality Assurance
Vignan Institute of Pharmaceutical Technology
Beside VSEZ, Duvvada, Visakhapatnam-530049, Andhra Pradesh, India
Abstract
For the estimation of Rabeprazole in bulk and tablet dosage form two simple and sensitive methods have been developed. In Method 1 folin–ciocalteu reagent and sodium hydroxide is used. Folin–Ciocalteu reagent reduced in the presence of sodium hydroxide by the Rabeprazole and blue coloured chromogen is formed, exhibiting absorption maxima at 640 nm and at a concentration range of 1–8 μg/ml linearity was obtained with correlation coefficient (r2) 0.9983. In method 2 rabeprazole reduced ferric nitrate. The reduced ferric ions reacts with 2,2, bipyridine, exhibiting absorption maximum at 522 nm and at concentration range of 2-16 μg/ml linearity was obtained with correlation coefficient (r2) 0.9994. According to ICH guidelines these two methods are validated and the methods were suitable for estimation of Rabeprazole in bulk and pharmaceutical dosage form.
Keywords
Rabeprazole, Folin-ciocalteu, 2, 2’ bipyridine, Visible spectrophotometric.
Introduction
Rabeprazole is chemically (RS)-2-(4-(3-methoxy propoxy)-3-methylpyridin-2-yl methyl sulphonyl)-1H-benzo (d) imidazole. Rabeprazole [1] is an antiulcer drug in the class of proton pump inhibitors. It mainly exhibits its action by suppressing the secretion of gastric acid from the gastric parietal cells. It helps in prevention of duodenal ulcers gasteroesophageal reflux diseases.
As per literature review for the estimation of Rabeprazole (Figure 1) in single and combined dosage form, there are spectrophotometric methods [2-13] and chromatographic [14-19] methods. Few visible methods are developed for rabeprazole estimation in tablet dosage form. As visible methods are commonly employed methods in pharmaceutical industry these methods are developed.
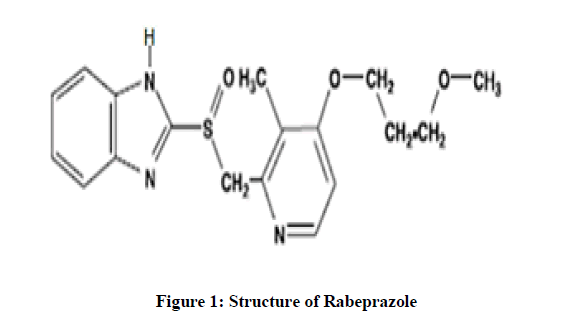
Figure 1: Structure of Rabeprazole
Materials and Methods
For all spectral measurements ELICO UV-Visible spectrophotometer model SL 210 and quartz cell 10 mm was used. Analytical grade chemicals were used throughout. Rabinol tablets containing 30 mg Rabeprazole was procured from local pharmacy. Folin-Ciocalteu (FC) reagent solution (three times commercially available Folin- Ciocalteu reagent was diluted with distilled water). NaOH solution (In 100 ml of distilled water 500 mg of sodium hydroxide was dissolved to get 0.5% w/v ), Fe (III) nitrate solution (in 100 ml distilled water 2 g of ferric nitrate was dissolved to get 2% w/v), 2,2’bypyridine (BPY) (in 100 ml of distilled water 100 mg of 2,2’bypyridine was dissolved to get 0.1%w/v).
Preparation of standard solution
To get 1000 μg/ml stock solutions in 100 ml volumetric flask 100 mg of rabeprazole was accurately weighed, dissolved in 50 ml methanol and made up the solution up to the mark. From the stock solution 100 μg/ml working standard was prepared by dilution.
Preparation of sample solution
Twenty tablets were accurately weighed; average weight of the tablet was calculated and pulverized. Rabeprazole powder equivalent to 100 mg was taken, dissolved in 25 ml of methanol, for 15 min it was sonicated and filtered using no 41 Whatman filter paper. To get 1 mg/ml solution the filtrate was made upto 100 ml with methanol. Further dilution was made to get 100 μg/ml. From this suitable volume was taken in 10 ml volumetric flask and analyzed as described under the procedures for bulk samples.
Absorption maximum determination (λmax)
Method I
From standard Rabeprazole (1000 μg/ml) solution, 1 ml was transferred into 10 ml calibrated tube. FC reagent of 0.5 ml was added to this and kept for 5 mins. Then, to the flask NaOH 0.5% w/v of 4 ml was added and shaken. Then the solution was made up to the mark with distilled water. The formed coloured solution was scanned within the range of 400-800 nm using reagent blank to get the absorption maximum. Absorption spectra (Figure 2), was plotted and 640 nm was concluded as the most suitable wavelength for estimating Rabeprazole.
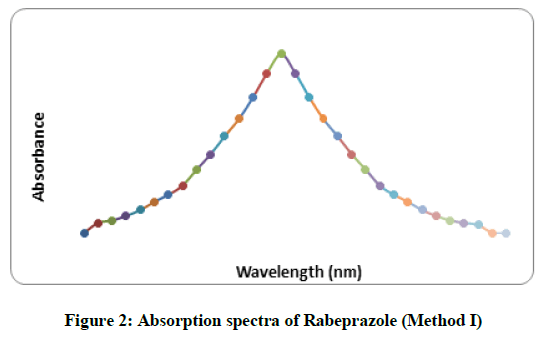
Figure 2: Absorption spectra of Rabeprazole (Method I)
Method II
From standard Rabeprazole (1000 μg/ml) solution, 1 ml was transferred into 10 ml calibrated tube. Ferric nitrate 2% w/v of 0.5 ml solution and 2, 2’bipyridine 0.1%w/v of 1.5 ml solution were added and kept for 15 mins. Then the solution was made up to the mark with distilled water The formed coloured solution was scanned within the range of 400-800 nm using reagent blank to get the absorption maximum. Absorption spectra (Figure 3), was plotted and 522 nm was concluded as the most suitable wavelength for estimating Rabeprazole.
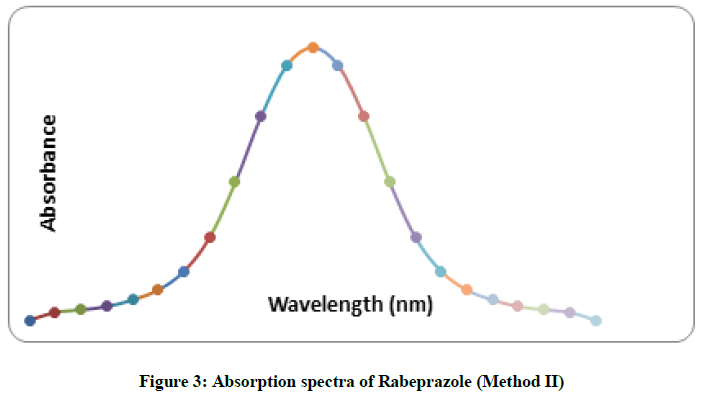
Figure 3: Absorption spectra of Rabeprazole (Method II)
Procedure for calibration curve
Method I
From the standard stock solution (100 μg/ml) of rabeprazole aliquots of (0.1-0.8 ml) were transferred into a series of 10 ml volumetric flasks. FC reagent 0.5 ml was added to each of the volumetric flask and kept side for 5 mins, sodium hydroxide 4 ml of (0.5%) was added, and the contents in the flask were shaken. To obtain concentrations of 1- 8 μg/ml the flasks were made up to 10 ml with distilled water. At 640 nm the absorbance of each solution against the reagent blank was measured.
Method II
From the standard stock solution (100 μg/ml) of rabeprazole aliquots of (0.2-1.6 ml) were transferred into a series of 10 ml volumetric flask. Ferric nitrate 0.5 ml of (2%) and 2,2’ bipyridine 1.5 ml of (0.1%) were added to each flask and kept side for 15 min. At room temperature it forms a red colored chromogen. The volumes were made up to 10 ml with distilled water to get concentrations of 2-16 μg/ml. At 522 nm the absorbance of each solution against the reagent blank was measured.
Results and Discussions
Results
Analytical method validation
According to current ICH guidelines method was validated.
Linearity and range
Calibration graphs were plotted by taking the values of absorbance and concentration. The graph were found to be linear over the concentration range of 1-8 μg/ml and 2-16 μg/ml for method I and II respectively. Co-relation coefficient, slope and y-intercept were calculated from the obtained data and were recorded in Table 1. Ideally co-relation coefficient should be not less than 0.998 and the Beer’s plots for method I and method II were shown in Figures 4 and 5.
| Parameter | Method I | Method II |
|---|---|---|
| λmax (nm) | 640 | 522 |
| Beer’s limit (µg/ml) | 8-January | 16-February |
| Molar extinction coefficient (l.mol-1 cm-1) | 1.1324 × 10⁴ | 1.4229 × 10⁴ |
| Sandell’s sensitivity (µg.cm-2/0.001 absorbance unit ) | 0.0336 | 0.0268 |
| Linear Regression equation* (y= bx+a) | Y=0.026x+0.005 | Y=0.03x-0.004 |
| Slope (b) | 0.0262 | 0.037 |
| Intercept (a) | 0.009 | -0.004 |
| Correlation coefficient (r) | 0.9983 | 0.9994 |
| Relative standard deviation (%) ** | 0.96 | 0.61 |
| % range | ||
| 0.01 level | 1.197 | 0.756 |
| 0.05 level | 0.809 | 0.511 |
* Y= bX+a, is a regression equation where X is the concentration of Rabeprazole in μg/ml and Y is the absorbance at respective λmax;** For six replicate samples
Table 1: Optical and regression characteristics of the methods
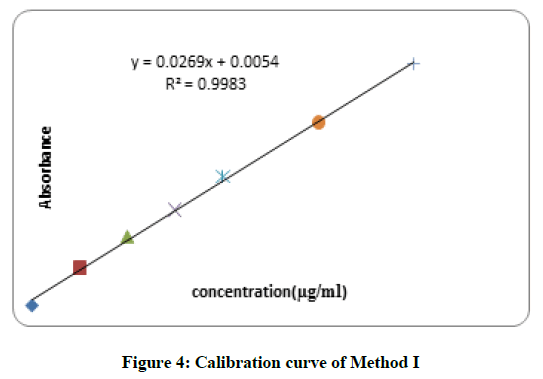
Figure 4: Calibration curve of Method I
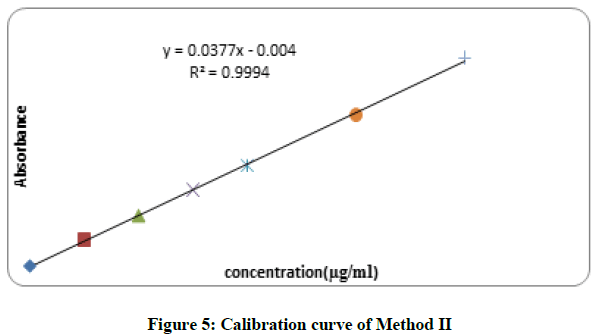
Figure 5: Calibration curve of Method II
Precision
The closeness of agreement between a series of measurement is expressed as precision. For 6 different solutions having same concentration were analysed and absorbencies were noted. Using % RSD the result was expressed in Table 1. Using three replicate sample solution Intra-day precision was investigated on the same day. Using newly prepared triplicate sample solution Inter-day precision was assessed over three consecutive days. Using % RSD inter day and intraday precision were expressed in Tables 2 and 3 and the results were summarized. The high precision of the above two methods are indicated by the low value of % RSD.
| Intraday | Interday | |||
|---|---|---|---|---|
| Con. taken (µg/ml) | Con. found* (µg/ml) | % RSD | Con. found* (µg/ml) | % RSD |
| 4 | 4.84 | 0.36 | 4.89 | 0.38 |
| 5 | 5.92 | 0.61 | 5.91 | 0.55 |
| 6 | 6.86 | 0.38 | 6.85 | 0.35 |
*average of six determinations
Table 2: Intraday and Interday precision for method I
| Intraday | Interday | |||
|---|---|---|---|---|
| Con. taken (µg/ml) | Con. found* (µg/ml) | % RSD | Con. found* (µg/ml) | % RSD |
| 8 | 8.98 | 0.34 | 8.95 | 0.38 |
| 10 | 10.93 | 0.36 | 10.96 | 0.21 |
| 12 | 12.95 | 0.36 | 12.14 | 0.45 |
*average of six determinations
Table 3: Intraday and Interday precision for method II
Accuracy
For the determination of accuracy for the above methods, solutions of different concentrations using pure drug was prepared that is 80%, 100% and 120% of targeted drug concentration to this constant amount of tablet formulation was added. In triplicates, Solutions were prepared and accuracy was determined in % recovery. In Tables 4 and 5 the results are shown.
| S. No. | %Level of Recovery | Initial amount present (μg/ml)** | Amount of standard Added (μg/ml)** | Total Amount present (μg/ml)** | Standard Amount Recovered (μg/ml)** | % Recovery ± S.D** |
|---|---|---|---|---|---|---|
| 1 | 80 | 5 | 4 | 9 | 3.96 | 99.0 ± 0.281 |
| 2 | 100 | 5 | 5 | 10 | 4.98 | 99.6 ± 0.312 |
| 3 | 120 | 5 | 6 | 11 | 5.94 | 99.0 ± 0.318 |
** Average of three determinations
Table 4: Accuracy of the Method I
| S. No. | %Level of Recovery | Initial amount present (μg/ml)** | Amount of standard Added (μg/ml)** | Total Amount present (μg/ml)** | Standard Amount Recovered (μg/ml)** | % Recovery ± S.D** |
|---|---|---|---|---|---|---|
| 1 | 80 | 10 | 8 | 18 | 7.95 | 99.37 ± 0.289 |
| 2 | 100 | 10 | 10 | 20 | 10.18 | 101.8 ± 0.309 |
| 3 | 120 | 10 | 12 | 22 | 11.95 | 99.58 ± 0.312 |
** Average of three determinations
Table 5: Accuracy of the Method II
Robustness
With the small changes in the conditions if a method remains unaffected it indicates the robustness of a method. For determination of robustness of a method, the assay was evaluated with deliberate alteration in experimental conditions. Using ± 2 nm the effect of detection wavelength was studied., the sample was assayed in triplicates to study the changes and were reported in Tables 6 and 7.
| Tablet | Amount of drug from tablet (mg) | At 638 nm | At 642 nm |
|---|---|---|---|
| (n=3)%Assay ± %RSD | (n=3)% Assay ± %RSD | ||
| Rabinol tab | 30 | 99.73 ± 0.313 | 99.91 ± 0.224 |
Table 6: Results of Robustness Study (Method I)
| Tablet | Amount of drug from tablet (mg) | At 520 nm | At 524 nm |
|---|---|---|---|
| (n=3)%assay ± %RSD | (n=3)%assay ± %RSD | ||
| Rabinol tab | 30 | 99.61 ± 0.423 | 99.84 ± 0.516 |
Table 7: Results of Robustness Study (Method II)
Ruggedness
For the proposed methods ruggedness was determined by two analyst using same operational and environmental conditions on aliquots of homogeneous slot and reported in Tables 8 and 9.
| S. No | Labelled amount (mg) | Analyst 1 | Analyst 2 | ||
|---|---|---|---|---|---|
| Amount found (mg) | %Recovered ± S.D. ** | Amount found (mg) | %Recovered ±S.D. ** | ||
| 1 | 30 mg | 29.98 mg | 99.96 ± 0.022 | 29.96 mg | 99.88 ± 0.042 |
** Average of six determinations
Table 8: Ruggedness results of Method I
| S. No | Labelled amount (mg) | Analyst 1 | Analyst 2 | ||
|---|---|---|---|---|---|
| Amount found (mg) | %Recovered ± S.D. ** | Amount found (mg) | %Recovered ± S.D. ** | ||
| 1 | 30 mg | 29.76 mg | 99.20 ± 0.033 | 29.94 mg | 99.82 ± 0.041 |
** Average of six determination
Table 9: Ruggedness results of Method II
Estimation of rabeprazole in tablet dosage form
In both methods marketed tablet formulations containing 30 mg of Rabeprazole was analyzed and reported in Table 10.
| Methods | Brand Name | Labeled found (mg) | Amount found *(mg) | %Purity ± SD* |
|---|---|---|---|---|
| Method I | RABINOL | 30 mg | 29.93 mg | 99.78% ± 0.02 |
| Method II | RABINOL | 30 mg | 29.83 mg | 99.45 % ± 0.049 |
*Average of six determination
Table 10: Estimation of Rabeprazole in tablets
Discussion
The above two methods developed at present for spectrophotometric determination of rabeprazole in tablets are simple, accurate and sensitive methods. In method 1 Rabeprazole has nitrogen contianing group which has unshared pair of electrons, act as reducing agent can reduce tungstate and molybdate present in FC reagent in alkaline medium forms blue coloured chromogen which exhibits absorption maximum at 640 nm. In method 2 oxidation followed by complex formation reaction of Rabeprazole with ferric nitrate and 2,2’ bipyridine took place, a red colored chromogen formed that exhibit maximum absorption at 522 nm. In both the methods optimum operating conditions were used. Beer’s law limit, Sandell‘s sensitivity, molar extinction co-efficient, relative standard deviation, limit of detection and limit of quantification were calculated and reported in Table 1. The visible methods developed for Rabeprazole was found to be accurate, economical and reproducible. The drug concentrations in the range of 1-8 μg/ml for method I and 2-16 μg/ml for method II are found to be linear. The correlation coefficient 0.999 shows that the developed methods were linear. To study Precision the relative standard deviation (% RSD) for system precision, intra-day and inter day were < 1% indicates the developed methods are precise. The percentage recovery values for method I 99-99.6% and Method II 99.37-101.8% indicates the high accuracy of the method. In the proposed methods the excepients present in the pharmaceutical formulations of rabeprazole do not interfere and the methods are accurate precise and sensitive. Hence can be used in routine analysis of pharmaceutical formulation depending upon the use os specific situation.
Conclusion
The above developed methods for the assay of Rabeprazole were simple, economical, selective and sensitive. The obtained results and recovery studies indicates clearly the accuracy of the methods. The sample recoveries in all formulations were in good agreement with their respective label claims. Analysis of the authentic samples containing Rabeprazole did not show any interference with the common excipients. Hence, these methods could be considered for the estimation of Rabeprazole in the pharmaceutical laboratories.
Acknowledgement
The authors are grateful to Dr. L. Rathaiah, Chairman of Lavu educational society for providing necessary facilities to carry out the above research work.
References
- C.I. Carswel, K.L Goa, Drugs., 2001, 61(15), 2327-2356.
- D. Sreenu, K. Sunil Babu, Int. J. Biol. Pharmaceut. Res.,2012, 1(1), 67-72.
- A. Nadeem, A. Khana, B Avinash, P. Balaram, A. Devika, Science Asia., 2009, 355-365.
- E. Michael, P.Y. Khashaba, E.M. Mohamed, Asian J. Biomed. Pharmaceut. Sci.,2013, 3(22), 42-53.
- A. Syed, A. Syeda, Indian J. Pharmaceut. Sci., 2008, 70(4), 507-510.
- P.M. Patel, H.J. Desai, R.C. Patel, N.M. Patel, Indian J. Pharmaceut. Sci., 2007, 69(2), 318-320.
- S.A. Gosavi, A.A. Shirkhedkar, S.J. Surana, Asian J. Chem.,2007, 19(6), 14-21.
- A.H. Mohamed, S.M. Suzy, B.S. Tarek, M.A. Ahmed, J. Appl. Pharmaceut. Sci.,2013, 3(11), 128-133.
- M.R. Kumar, T.S. Reddy, K. Prabhavathi, Chemical Science Transactions., 2013, 2(1), 234-238.
- D. Madhuri, K.B. Chandrasekhar, M. Ramakotaiah, G. Somasekhar, K. Harinadhababa, K.R. Kumar, Int. J. Res. Pharmaceut. Sci., 2010, 1(2), 209-211.
- P.T. Kanekar, S.S. Kamat, P. Das, E.V.S. Subrahmanyam, A.R. Shabaraya, Int. J. Pharmaceut. Chem. Biol. Sci.,2013, 3(2), 411-417.
- S. Gul, S. Basheer, Saudi J. Med. Pharmaceut. Sci., 2017, 3(8), 813-817.
- G. Pandey, K Mishra, Int. Res. J. Pharm., 2013, 4(3), 34-38.
- V.A. Ranjani, J.P Kumar, K.S.B. Kumar, Int. J. Pharm. Pharmaceut. Res., 2016, 6, 4, 112-115.
- M.K. Reddy, B. Chiranjeevi, P. Shanmugasundaram, Int. J. Chemtech. Res., 2011, 3, 32-36.
- S. Elumalai, K. Aher, G. Bhavar, S. Gupta, J. Appl. Pharmaceut. Sci., 2011, 165-170.
- B.H. Patel, M.M. Patel, R.J. Patel, B.N. Suhagia, J. Liq. Chrom. Rel. Tech., 2007, 30(3), 439-445.
- B.R. Prasanna, M.S.Reddy, Asian J. Res. Chem., 2009, 2(1), 495-499.
- C.V. Garcia, C.S. Paim, M. Steppe, JAOAC Int., 2004, 87(4), 842-846.


