Research Article - Der Pharma Chemica ( 2018) Volume 10, Issue 5
In-Vitro Quality Assessment of Different Marketed Brands of Ofloxacin Tablets
Virender Singh, Prince Sharma, Akash Jain and Jasmine Chaudhary*
M. M. College of Pharmacy, M. M. Deemed University, Mullana (Ambala), Haryana-133207, India
- *Corresponding Author:
- Jasmine Chaudhary
M. M. College of Pharmacy
M. M. Deemed University
Mullana (Ambala), Haryana-133207, India
Abstract
The quality of pharmaceuticals is always a matter of global concern because counterfeit medications with substandard quality are increasingly detected worldwide, the reason for which can be that these drugs may not have been subjected to strict approval processes by relevant regulatory agencies. So, in order to ensure the requisite quality, it should be mandatory for the drug manufacturers to analyze their products during each level of manufacturing and processing. Moreover some multinational brands are so costly and thus unaffordable to common people and comparatively local brands of same generic are available at much lower prices. But to select one product from several generic drug products of same active ingredients is the cause for concern for the common people. So, every effort should be done to make these drugs chemically and pharmaceutically equivalent in every aspect as the branded drugs which can only be possible if proper quality control guidelines are being followed during their production. Most of the consumers are specific to a particular brand which they are using from a very long time despite their high cost. So, there is a need to satisfy the consumer by ensuring that the generic and branded drugs products can be equally effective.
Keywords
Generic, Brand, Assessment, Ofloxacin, Quality
Introduction
Quality of pharmaceutical product is the most important for efficacy and safety of product. The safety, effectiveness and efficacy of pharmaceutical dosage form can be guaranteed when its quality is reliable [1]. Today market is enriched with various brands of drugs. So, the selection of one product from various drug products of the same active ingredients is a matter of concern for healthcare workers. Accordingly, need to ensure that whether all the brands of drugs products are pharmaceutically equivalent cannot be overemphasized [2]. Almost all brands contain same amount of drug and are generally chemically equivalent in terms of active ingredients but may differ in other aspects such as color, shape, excipients employed, and manufacturing process [3]. Therefore, comparative analysis is carried out to check, compare and evaluate the quality standards of commercially available local pharmaceutical brands of tablets with each other. So, all brands of the drug should meet all the quality standards as per the official books like USP, BP, IP, etc. and thus can be widely prescribed to reduce the medication cost and make the treatment economical to the patients [4].
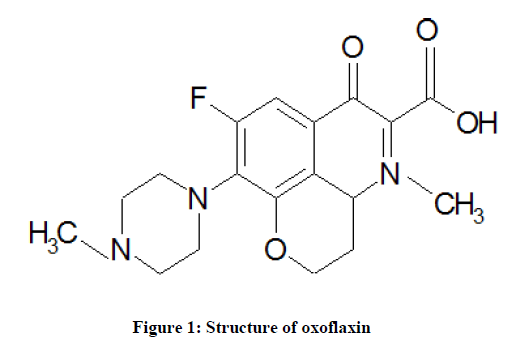
Ofloxacin (Figure 1) is the most widely prescribed broad spectrum antibiotic used for bacterial infections which acts on Deoxyribonucleic Acid (DNA) gyrase and toposiomerase IV, enzymes and prevents the excessive supercoiling of DNA during replication or transcription. By inhibiting their function, the drug thereby inhibits normal cell division [5]. Various brands of ofloxacin are available in the market so the quality of the various brands commercially available should be ensured in order to assess their quality control which will help in the selection of best brand of drug [6].
Material and Methods
Three easily available commercial brands of ofloxacin 200 mg tablets were purchased from local market (Table 1). Ofloxacin pure was obtained as a gift sample. All reagents used were of analytical grade.
| S. No. | Brand Name | Batch No. | Mfg. Date | Exp. Date | Mfg. By |
|---|---|---|---|---|---|
| 1 | Abott Nicloflox-200 (Brand A) | 50164446 | Mar-16 | Feb-19 | Scott-Edil Pharmacia Ltd. |
| 2 | Cipla Tariflox (Brand B) | AEP6073 | Jul-16 | Jun-18 | Shivalik Remedies Pvt. Ltd |
| 3 | Ridley Ridflox-200 (Brand C) | TFT-1601 | Jun-16 | May-19 | Ridley Life Science Pvt. Ltd. |
Table 1: Brand of ofloxacin selected for evaluation
Methods used for evaluation [7,8]
Various evaluation tests were being performed on the selected bands of ofloxacin to compare their quality characteristics.
Visual Inspection
Thickness of tablets (random 5 tablets) using Vernier caliper and visual examination of all brands of tablets w. r. t. shape, size, and color was done and observations are reported in Table 2.
| Brand Name | Color | Shape | Texture | Thickness |
|---|---|---|---|---|
| A | Pale yellow | oval | smooth | 3.5 mm ± 0.034 |
| B | Pale yellow | round | smooth | 4.0 mm ± 0.109 |
| C | white | round | rough | 3.9 mm ± 0.026 |
Table 2: Visual parameters
Weight variation Test (Uniformity of weight)
To check whether tablet contain desired amount of drug, twenty tablets from each brand were randomly selected and weighed individually by using an electronic weighing balance & average weight for each brand was calculated as per the equation given below and results are recorded (Table 3). Tablet meet USP test if no more than 2 tablets are outside the percentage limit and if no tablet differs by more than two times the percentage limit.

Hardness and Friability Test [9]
Hardness using Monsanto Hardness Tester and Friability using Roche Friabilator was checked to evaluate resistance of tablet to chipping, abrasion, or breakage under condition of storage, transportation and handling before usage. The friability of the tablets were then calculated using the following expression
% Friability = [(Initial weight – Final weight)/Initial weight] x 100
Results are shown in Table 3. Tablet passes the hardness test if crushing strength is between 4 kg/cm2-10 kg/cm2 and friability should be not more than 0.8% as per BP and not more than 1% as per USP.
| Brand | Average weight | % deviation allowed ( ± 7.5%) | Friability % | Hardness kg/cm2 | Disintegration Time (min) |
|---|---|---|---|---|---|
| A | 253.87 ± 0.158 | 234.83 - 272.91 | 0.0177 | 05-Jul | 5.03:07 |
| B | 269.50 ± 0.123 | 249.29 - 289.71 | 0.0278 | 04-May | 07:13:44 |
| C | 253.60 ± 0.199 | 234.58 - 272.62 | 0.0664 | 06-Jul | 02:12:39 |
Table 3: Weight variation, friability, hardness and disintegration studies
Disintegration Test
Disintegration test is carried out using ERWEKA disintegration apparatus to determine whether pharmaceutical dosage forms like tablets etc. disintegrates within a time when placed in liquid medium under the prescribed experimental condition. The disintegration time is taken to be the time during which no granule of any tablet is left on the mesh. The results for disintegration are shown in Table 3.
Dissolution
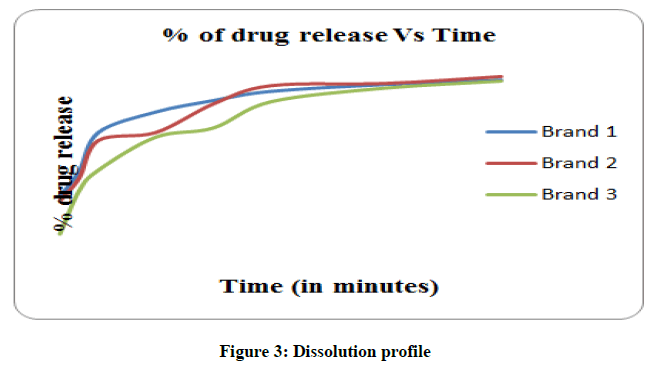
Dissolution testing of drug product is an important criterion in assessing the in vitro drug release information for quality control purposes and also in drug development. The test thus describes the overall rate of the processes involved in release of the drug into a bioavailable form. The variations in the drug release among some generics indicate deficiency in the entire drug formulation and the delivery system. Dissolution test was carried out by using an Erweka dissolution instrument. Paddle method was used at 50 rpm. Hydrochloric acid 0.1N (900 ml) prepared as dissolution medium, was poured into the vessel and equilibrated to 37 ± 0.5°C. Six tablets from each brand were randomly selected and one tablet was put in each of the compartments of the apparatus containing 1000 ml of medium at 37 ± 0.5°C. Ten milliliters of sample was drawn at intervals of 5, 10, 15, 30, 45, 60 minute with 10 mL pipette and a fresh 10 ml dissolution medium was replaced after each sampling to maintain the sink conditions. Each of the withdrawn samples was filtered and the filtrate is further diluted and the absorbance was measured at 233 nm against dissolution medium using UV visible spectrophotometer. The percentage of drug released is calculated using the formula and results are shown in Table 4 and Figure 2.
| TIME IN MIN | % of drug release | ||
|---|---|---|---|
| Brand 1 | Brand 2 | Brand 3 | |
| 5 | 45.45 | 43.48 | 28.8 |
| 10 | 56.61 | 53.59 | 48.01 |
| 15 | 73.82 | 70.28 | 57.1 |
| 30 | 82.89 | 73.82 | 71.77 |
| 45 | 87.97 | 86.46 | 75.82 |
| 60 | 92.02 | 94.55 | 87.43 |
| 90 | 95.05 | 95.56 | 93.48 |
| 120 | 97.07 | 98.59 | 96.57 |
Table 4: Drug dissolution studies
Content assay
Every tablet contains the amount of drug substance intended, with little variation among tablets within a batch. Analysis of drug potency in tablets not only indicates the presence of drug in dosage form but also requisite for the establishment of stability data.
Preparation of standard solution
10 mg of standard pure drug was dissolved in small amount of solvent after which it was sonicated for 10 min and then volume was made with solvent to get standard solution of 1000 μg/ml. From this solution, 1 ml of the solution is taken and further diluted to get working standard solution of 10 μg/ml.
Preparation of calibration curve
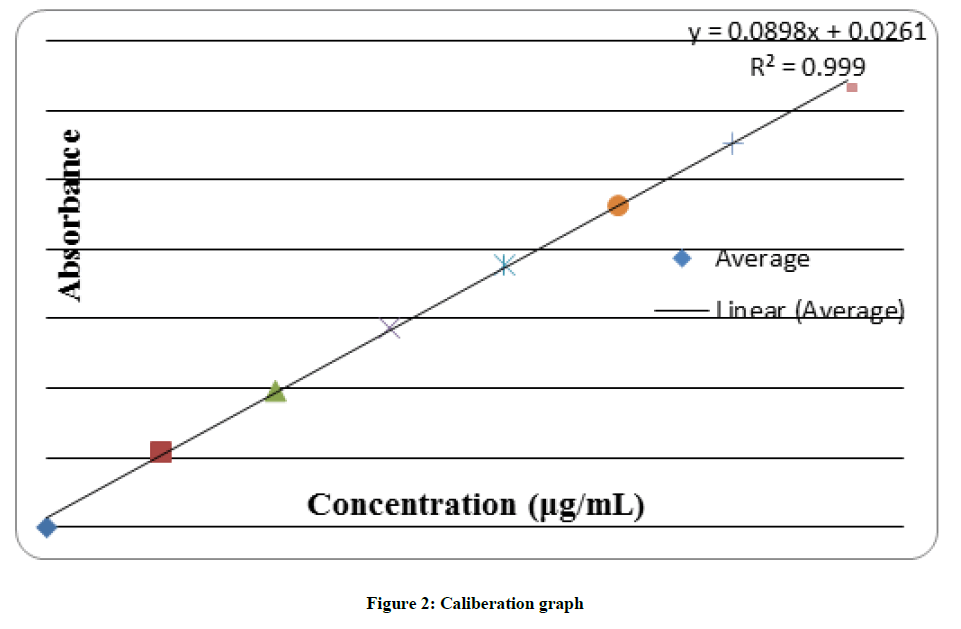
Above solution was scanned in UV spectrum range between 200-400 nm and wavelength of maximum absorbance was determined. Then appropriate aliquots were taken from standard stock solution and diluted with the solvent to get working solutions of 2, 4, 6, 8, 10, 12 μg/ml. The absorbance of prepared solutions were observed and then plotted against their respective concentration to get the calibration graph. From the calibration graph, linearity equation is being determined for further calculations (Figure 2).
Preparation of sample solution
Sample was prepared by weighing and crushing 20 tablets and transferring amount of drug substance equivalent to 200 mg of standard substance in 100 ml of volumetric flask and dissolved in small amount of 0.1N HCl and then making the volume up to the mark. Portion of solution was filtered and the filtrate was further diluted to obtain the final working dilution of 10 μg/ml. Absorbance is then being observed at the selected λmax and concentration is then determined using the linearity equation (Table 5).
| Brand | Absorbance | Concentration (ug/ ml) | Amount present (mg) | Label claim (mg) | % |
|---|---|---|---|---|---|
| Brand 1 | 0.912 | 9.95 | 199.5 | 200 mg | 99.75% |
| Brand 2 | 0.907 | 9.89 | 198.9 | 200 mg | 99.45% |
| Brand 3 | 0.919 | 10.03 | 200.3 | 200 mg | 100.15% |
Table 5: Drug content uniformity
Results and Discussions
All the selected brands i. e., Brand A (Nicloflox-200), Brand B (Ridflox-200) and Brand C (Tariflox) of ofloxacin were investigated for their compliance with the standard pharmaceutical requirements and the results proved the quality and efficacy according to the USP standards. The visual physical characteristics of the samples are described (Table 2).
Brand B and C tablets were round in shape whereas Brand A is oval. Both Brand A and B are pale yellow in color with smooth texture whereas Brand C is white with rough texture. However thickness is almost same for all the brands and consistency in thickness also exist between individual tablets of each brand. Results of weight variation test revealed that all brands selected complied with acceptance limits (Table 3) and deviation of individual tablet weights from the average weight is within the official specification (± 7.5%) as stipulated by USP. Friability is mechanical property of a tablet with a compendial specification not more than 1% as per USP. The results indicated that all the brands have % friability less than 1% so all the brands passed friability test as per USP (Table 3). Hardness is optimum and is between 4-7 kg/cm2 which indicate its good capability to resist chipping and is also good for disintegration and dissolution. Disintegration time (less than 8 minutes) is as per the USP limits (within 30 minutes for uncoated tablets) and is indicative of good disintegration of all tablets.
The drug content is found between 99-101% which assures that amount of ofloxacin in each brand complies the pharmacopoeial standards.
Dissolution studies indicated that more than 75% drug got released within 30 min and more than 96% in 120 min (Figure 3) which is as per the official compendia and thus assure that these can be used interchangeably although manufactured by different companies.
Conclusion
The in-vitro evaluation of selected brands was assessed and it was observed that although a little variation existed among drugs of different brands but all selected brands show parameters within official USP specification with respect to quality and efficacy which reflects that these formulations can be used interchangeably. Thus it can be concluded that to assure that different brands of same active ingredient are pharmaceutically equivalent or not, quality control and quality assurance authority should monitor the uniformity of drug substance during each step of manufacturing and processing.
Acknowledgement
Authors are thankful to MM College of Pharmacy, Mullana for providing the necessary facilities.
References
- M.M. Gupta, M. Gupta, I. J. P. S. R., 2016, 11, 2830-36.
- D.R. Jadge, A.N. Deshpande, A.B. Gadgul, Y.A. Pandilwar, O.P. Patil, I. J. P. H. C., 2014, 4 (4), 40-47.
- T.Y. Elghnimi, M.A. El-Majri, R. Bennouh, A. Enkessa, M.M. Siaan, I. J. P. S. R., 2016, 7(6), 2402-09.
- A.M.A. Masaad, R. Majed, I. O. S. R. P. H. R., 2016, 6(2), 14-19.
- L.A. Hussein, E.M. Hussien, N. Magdya, H.S. Mohamed, Bull. Fac. Pharm. Cairo. Univ., 2017, 55(1), 171-176.
- N. Safila, T. Alam, A. Hameed, N. Sharif, J. Bioequiv. Availab., 2014, 8, 125-127.
- L. Lachman, H. Liberman, J Kanig, The theory and practice of industrial Pharmacy, Varghese Publishing House, Mumbai, 1987, 3, 171-195, 293-345.
- M.S.K. Naik, M. Devendra, P.M. Babu, B.M. Ishaq, E.S. Kumar, H.A. Ahad, R. Dhani, I. J. C. T. P. R., 2014, 2(3), 477-482.
- K.A. Kishore, P. Amareshwar, J. Curr. Chem. Pharm. Sc., 2012, 2(1), 24-31.


