Research Article - Der Pharma Chemica ( 2022) Volume 14, Issue 3
In Silico Molecular Modeling Study on Isatin Derivatives as Anti-Covid Agents Based on Qsar and Docking Analysis
Ganesh D. Mote1*, Shubhangi S. Savale1, Shubhangi S. Kharat2 and Aditya A. Bandgar12Department of Pharmaceutics, Annasaheb Dange College of Pharmacy, Ashta, Sangli, Maharastra, India
Ganesh D. Mote, Department of Pharmaceutical Chemistry, Annasaheb Dange College of Pharmacy, Ashta, Sangli, Maharastra, India, Email: ganeshmote2010@gmail.com
Received: 31-Jan-2022, Manuscript No. dpc-22-52922; Accepted Date: Feb 02, 2022 ; Editor assigned: 02-Feb-2022, Pre QC No. dpc-22-52922; Reviewed: 18-Feb-2022, QC No. dpc-22-52922; Revised: 24-Feb-2022, Manuscript No. dpc-22-52922; Published: 03-Mar-2022, DOI: 10.4172/0975-413X.14.3.1-15
Abstract
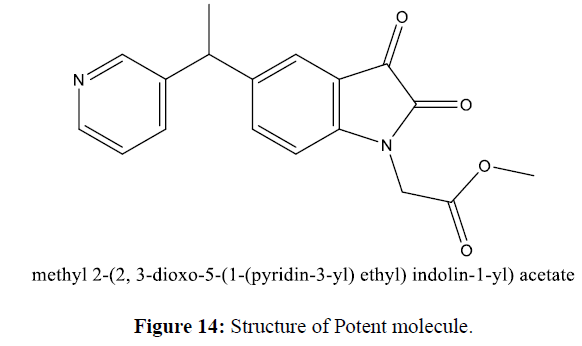
COVID 19 disease caused by novel SARS-CoV-2.It rapidly infects mammals and causes serious illness and death. The drug development against COVID 19 is a challenging task as COVID 19 disease spreads rapidly throughout the world. Drug development is a time-consuming process, but pandemics create an emergency to Design drugs as earlier as possible. In silico drug design is the key to fast-developing drug candidates. Corona virus’s main protease plays a vital function in the viral reproduction cycle and is a potential target for COVID 19 inhibitor development. Most of the Isatin derivatives show potential activity against COVID 19. All possible COVID-19 inhibitors were designed by using reference molecule and QSAR study. V life MDS software has the facility drug development techniques like 2D-QSAR MLR analysis and 3D-QSAR kNN analysis. We designed 50 new Chemical entities molecules from 2 D QSAR and 3D QSAR and screened through the Lipinski rule of 5. All designed molecules satisfied the Lipinski screening criteria for the compatibility of drug to the body. Target enzyme i. e Main Protease (PDB: 6lu7) were downloaded from PDB site and studied docking interaction of new molecules with target enzyme by using Auto dock software. Docking of these new molecules also were checked with target enzyme by using V-life MDS software and docking score calculated. Study shown that one of the Isatin derivative methyl 2-(2, 3-dioxo-5-(1-(pyridin-3-yl) ethyl) indolin-1-yl) acetate (Dock score: -76.040 kcal/mol) new molecule entity shown potent activity than reference standard that is Ritonavir (Dock Score:-14.694 kcal/mol). This study indicates that Isatin derivatives potentially act as Anti-SARS-CoV-2 drugs.
Keywords
COVID 19; docking studies; Isatin derivative; Main Protease inhibitor; NCE; QSAR studies
Introduction
At the end of the year 2019, Coronavirus was identified in Wuhan, China. This is a highly pathogenic and transmissible viral infection spread throughout the world. It predominantly attacks human respiratory system causing the severe acute respiratory syndrome. Based on genetic, the viruses have four genera: Alpha-coronavirus and Beta-coronavirus infect the mammals, and Gamma-coronavirus and Delta-coronavirus infect birds [1].
The virus causing COVID-19 disease is a spherical enveloped having positive-sense single-stranded RNA associated with a nucleoprotein within a capsid comprised of matrix protein. The envelope bears crown-shaped glycoprotein projections. Some coronaviruses also contain a hemagglutinin-esterase protein 4. The genome contains a unique N- terminal fragment within the spike protein [2]. Also, coronavirus invades the epithelial cells by using angiotensine-converting enzyme 2 (ACE2), or other cell components like integrins, as targets of the SARS-CoV-2 S protein after inhaling droplets containing the virus. Viral reproduction starts in Type II alveolar epithelial cells causes a severe change of innate immunity. Lungs are rapidly compromised following direct damage of the pulmonary tissue, mainly through uncontrolled immune mediators that enhance the entry of monocytes and neutrophils into the infected tissue. Additionally, a pro-inflammatory cytokine storm affects virus replication and increases its diffusion to nearby cells [3].
The main protease enzyme in corona virus participates in assemble and multiplication of the virus. Disrupting this virus's self-replicating machinery can be one of the best targets without causing harm to the host. It has an active site for inhibition. The new chemical entity can interact at this site and inhibit the replication cycle. In this pandemic, the situation world needs a potent active drug candidate for the treatment of disease. The drug discovery by using computer-aided drug design tool gives promising drug candidates in less time. Pharmaceutical agents are found based on disease mechanisms, the molecular targets that should be modified to normalize the pathological process, and the ligand that could interact with these targets. Information regarding the target is crucial to studying the interaction of a new drug with it. Molecular modeling and QSAR are very useful in optimizing molecules since results can be achieved faster. The Isatin derivative shows various activities like anticancer, anti-inflammatory, and so on. In that antiviral activity of Isatin derivative shows promising activity against COVID-19. The main protease is the key enzyme that is targeted for activity. 2D-QSAR and 3D-QSAR studies give the idea to design a new chemical entity. Those NCEs are further evaluated for a physiochemical property. Evaluated NCEs are further docked with the active site of the main protease enzyme of COVID-19.
Materials and Methodology
Data Set and Biological Activity
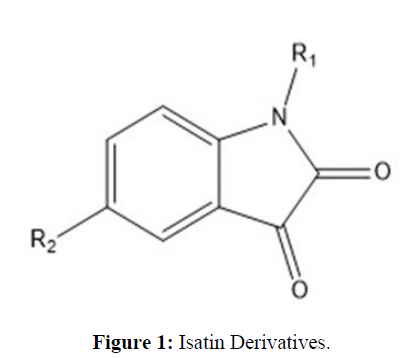
A data set (26 molecules) of Isatin derivatives has different biological and chemical activities, reported by Wei Liu et al. against COVID-19, used for the QSAR studies given in (Table 1) Biological activity is given in IC50 (half-maximal inhibitory concentration) converted into the corresponding pIC50 (negative log of the IC50 value) [4] (Figure 1).
| MOLECULE | IC50 (uM) |
pIC50 | R1 | R2 |
|---|---|---|---|---|
| 1 | 0.37 | 6.43 | β-C10 H7 | -CONH2 |
| 2 | 0.95 | 6.02 |
|
-I |
| 3 | 76.74 | 4.12 | - | 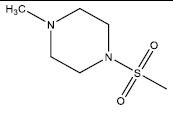 |
| 4 | 31.71 | 4.4988 | - | 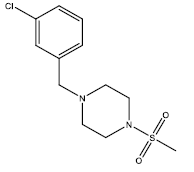 |
| 5 | 32.08 | 4.4937 | - | 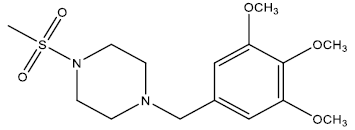 |
| 6 | 34.91 | 4.457 | - | 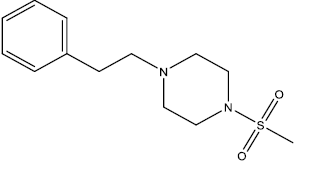 |
| 7 | 10.07 | 4.9969 | - | 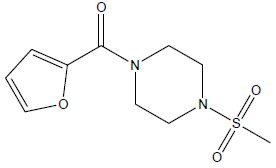 |
| 8 | 51.33 | 4.2896 | - | 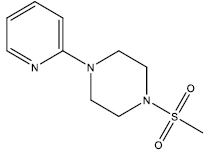 |
| 9 | 4.45 | 5.3516 | - | 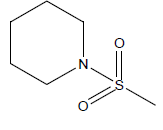 |
| 10 | 12.66 | 4.8975 | - | 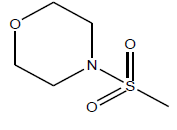 |
| 11 | 1.18 | 5.9281 | - | 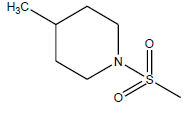 |
| 12 | 2.25 | 5.6478 | - | 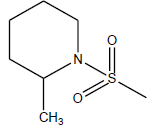 |
| 13 | 4.3 | 5.366 | - | 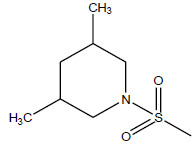 |
| 14 | 11.83 | 4.927 | -CH3 | 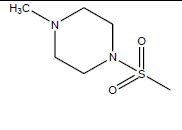 |
| 15 | 9.91 | 5 | -CH3 | 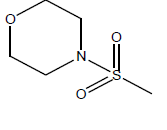 |
| 16 | 1.04 | 5.9829 | 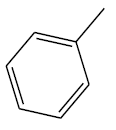 |
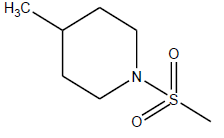 |
| 17 | 2.82 | 5.5497 |  |
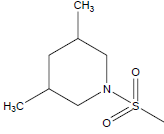 |
| 18 | 67.2 | 4.1726 |  |
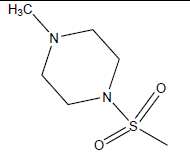 |
| 19 | 82.91 | 4.081 | β-C10 H7CH2- | 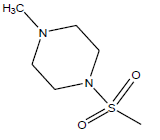 |
| 20 | 5.52 | 5.258 | β-C10 H7CH2- | 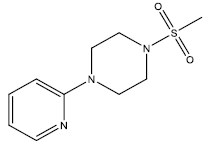 |
| 21 | 13.86 | 4.8582 | β-C10 H7CH2- | 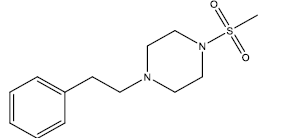 |
| 22 | 14 | 4.8538 | β-C10 H7CH2- | 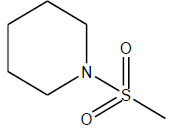 |
| 23 | 39.87 | 4.3993 | β-C10 H7CH2- | 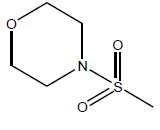 |
| 24 | 1.69 | 5.77 | β-C10 H7CH2- | 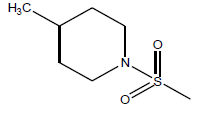 |
| 25 | 17.82 | 4.749 | β-C10 H7CH2- | 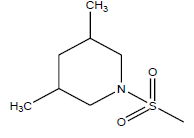 |
| 26 | 4.7 | 5.3279 | -CH3 | 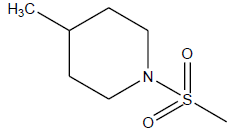 |
Molecular Modeling study
Molecular modeling study is software-based. It is done by using an HP laptop with Intel Pentium Gold Processor and Windows 10 operating system using various software. Structures were drawn in Chem Draw 8.0 2D, and energy minimization and geometry optimization using Merck Molecular Force Field (MMFF) with a fixed energy gradient of 0.001 kcal/mol Å and distance-dependent dielectric function were achieved using Chem Draw 3D [5]. 2D and 3D-QSAR Study and Docking Study were carried out by using V-life MDS 4.0 Software. Lipinski Screening was carried out by using the web tool Swiss ADME.
Experimental Design
To evaluate the QSAR model, 2D and 3D, the selected molecules were categorized into a test set and Training set by using the Random/manual Selection method. It is the process by which molecules are categorized into a test set and Training set in distinct percentages/ratios. Usually, the test to training ratio is 20:80 or 30:70 is preferred. 26 selected molecules for study are categorized into the test set and training set (6:20).QSAR models are developed based on the training set, which has known biological activity data, while the test set is used to assess the predictive power of the models developed based on the training set and not considered during model generation. Many trails were run for the perfect Model [6].
Uni-Column Statistics
Using uni-column statistics confirmed that groups of molecules in the trained and test sets had a uniform representation. It was also found that minimum and maximum values should be compared to consider each group's characteristics.
i. Test maximum must be less than the maximum of the train set
ii.Test minimum must be higher than the minimum of the train set.
By comparing the mean and standard deviation across the train and test set, we can understand how relative the two sets are in terms of density distribution and mean. The higher mean in the test set (nearly twice as high) than the train set indicates that comparatively more active molecules exist in the test set. Additionally, both sets had relative standard deviations, meaning the spread in both sets was comparable to the mean of each set [5].
2D-QSAR ANALYSIS
Calculation of Descriptor
For the 2D-QSAR study, different models were developed using MLR with simulated annealing as a variable selection method. About 100 independent descriptors have been processed by removing the invariable column before various 2D descriptors like topological, physicochemical, alignment-independent, and atom-type count data have been calculated. In order to obtain the most representative descriptors, the correlation matrix has been refined further in selecting descriptors. We calculated the descriptor number after optimizing or minimizing the energy of the molecules in the data set. Descriptors of physicochemical composition were calculated such as Individual ( slogp, smr, polarizability, XlogP, MW, H-donarCount, H-acceptorCount, Volume), Chi ( chi0, chi1), Chiv ( chiV0, chiV1), Path Count ( 0PathCount, 3PathCount), ChiChain ( chi3chain, chi4chain), Chain Path Count ( 3Chaincount, 4ChainCount), Element count ( HydrogensCount, OxygensCount, CarbonsCount), Dipole moment ( Quadrapole1, DipoleMoment), Distance-based topological ( DistTopo, MomInertiaX, BalabanIndexj), Estate number ( SssssCcount, SaaCcount, SdCH2count, SssPHcount, SsIcount), Estate Contribution ( SddCE-Index, StNE-Index, SsPH2E-index), HydrophobicityXlogP, PolarSurfaceArea ( PolarSurfaceAreaExcludingPandS, PolarSurfaceAreaIncludingPandS), XKAverageHydrophilicity, Information Theory index ( Idw, IdAverage, Id), Path Cluster ( chi4pathCluster, 4pathClusterCount). The following attributes were also used to calculate more than 700 alignment dependent descriptors like T_O_S_5, T_C_O_2, S_O_2_1, T_2_N_5, T_T_2_N etc. All invariable descriptors (defined by constants for all molecules) were removed because they do not contribute to QSAR [7].
Generation of Test and Training set
Generation of Model
Multiple linear regression (MLR) was used to conduct 2D-QSAR studies of series isatin derivatives as Anti-COVID agents using VLife Science's QSAR pro software. The Model is fitted when the sum-of-squares of differences of observed and a predicted value is minimized. Using the least-squares method to fit the curve, MLR estimates regression coefficients (r2). The Model creates a straight line (linear) relationship that best approximates all the individual data points. The idea of MLR analysis was extended to include several independent variables [8].
3D-QSAR Analysis
Calculation of descriptor
There are numerous models obtained through 3D-QSAR that contain a variety of descriptors that were used to design Pharmacophores and NCEs. Three types of 3D descriptors were calculated: electrostatic, steric, and hydrophobic. The nearness of molecules in the lattice is decided by interaction energy values considered for relationship generation and utilized as descriptors. Interaction energies of electrostatic and steric were computed using a methyl probe of charge +1 at lattice point. The term descriptor is used to indicate field values at the lattice points. The sphere exclusion algorithm method is used to generate training and test set. This algorithm constructs the training sets covering descriptor space occupied by particular points. When the test and training sets are generated, the kNN method is applied to the descriptors generated over the grid. Many models were generated [9].
Generation of Model
In 3D-QSAR, kNN-MFA is one of the newer methodologies. Conventional correlation generates a linear relationship with biological activity. However, kNN can manage non-linear relationships of biological activity with field descriptors, making it more accurate and better-explaining activity trends. The kNN-MFA methodology is a simple perspective to pattern recognition problems. In this technique, an unknown pattern is categorized as per the majority of the class memberships of its k nearest neighbours in the training set. A proper distance metric measures the nearness (e.g., a molecular similarity measure, calculated using field interactions of molecular structures). kNN-MFA with Stepwise (SW) Variable Selection is a method that introduces a stepwise variable selection process combined with kNN to optimize the number of nearest neighbours (k) and the selection of variables from the original pool described in simulated annealing [9].
Best model selected for 2D and 3D-QSAR is based on the following statistical parameters
n, number of molecules ≥20 molecules;
r2, the square of regression ≥ 0.7;
q2, cross-validated r2 ≥ 0.5;
pred r2 for external test set ≥ 0.5;
F-test, F-test for statistical significance of the Model (must be higher)
Pharmacophore modeling and Designing of New Chemical Entities (NCEs) From the 2D-QSAR and 3D-QSAR data Isatin, Pharmacophores is designed. The NCEs are designed that are subjected to Lipinski Screening. Lipinski screening was done by using Swiss ADME. Screened NCEs are furthers Docked.
Molecular Docking Study
The V-Life MDS 4.3.BioPredicta tool was used to evaluate the binding free energy of the new drug candidate bind to the target enzyme. Target enzyme is downloaded in PDB format from the protein data bank, and the complexes were energy minimized using the MMFF method using V-life MDS software. Prepared protein is analyzed for an active binding cavity. GRIP docking of all designed NCEs and active cavity was performed. Docking Score is obtained in kcal/mol. Various Docking interactions are obtained by GRIP docking with a distance of interaction.
Result and Discussions
Uni-Column Statistics
Using uni-column statistics confirmed that groups of molecules in the trained and test sets had a uniform representation. It was also found that minimum and maximum values should be compared to take into consideration each group's characteristics.
i. Test maximum must be less than the maximum of the train set
ii. Test minimum must be higher than the minimum of the train set.
By comparing the mean and standard deviation across the train and test set, we can understand how relative the two sets are in terms of density distribution and mean. The higher mean in the test set (nearly twice as high) than the train set indicates that comparatively more active molecules exist in the test set. Additionally, both sets had relative standard deviations, meaning the spread in both sets was comparable to the mean of each set [5] (Table 2).
| Data set | Average | Max. | Min. | StdDev | Sum |
|---|---|---|---|---|---|
| 2D-QSAR Model | |||||
| Training | 5.0626 | 6.43 | 4.081 | 0.672 | 101.2511 |
| Test | 5.0292 | 5.77 | 4.12 | 0.6462 | 30.1753 |
| 3D-QSAR Model | |||||
| Training | 5.0242 | 6.43 | 4.081 | 0.6939 | 100.4842 |
| Test | 5.157 | 6.02 | 4.4937 | 0.5372 | 30.9422 |
2D-QSAR
By using reference data set, we have calculated various descriptors for given compounds. MLR (multiple linear regressions) is one of the best methods used in 2D-QSAR that gives statistical data. MLR is done by selecting molecule in the set as test and Training with 20:80 ratios by random selection method considering pIC50 as an independent variable and other calculated descriptors as a dependent variable. Various models 2D-QSAR models were generated by using MLR. The best Model should be selected based on values of statistical parameters like Degree of freedom (n – k -1) (higher is better); r2, a square of regression (>0.7); q2, cross-validated r2 (>0.5); pred_r2 for the external test set (>0.5) should always be more significant than given values. The best 2D-QSAR models are given in (Table 3).
| Sr. No. | Statistical parameter | 2D-QSAR Model | |
|---|---|---|---|
| Model 1 | Model 2 | ||
| 1. | N | 20 | 20 |
| 2. | Degree_of_freedom | 16 | 9 |
| 3. | r2 | 0.797 | 0.9211 |
| 4. | q2 | 0.6279 | 0.8251 |
| 5. | F_test | 20.9438 | 10.5138 |
| 6. | r2_se | 0.2854 | 0.2649 |
| 7. | q2_se | 0.3865 | 0.3945 |
| 8. | pred_r2 | 0.6267 | 0.7494 |
| 9. | pred_r2se | 0.5955 | 0.3657 |
Interpretation of 2D-QSAR models
As we have taken multiple trials of regression analysis and obtained models show statistical values within a range. Here we have chosen the two best models of MLR analysis (Table 4)
| Model | Selected Descriptor | Coefficient |
|---|---|---|
| Model 1 | XAHydrophilicArea DistTopo SdssCcount |
-0.0117(±0.0000) 0.8426(±0.2553) 0.7058(±0.2934) |
| Model 2 | G_N_T_6 T_S_2_5 T_S_N_1 SssOE-index T_Cl_T_5 XAHydrophobicArea T_O_2_4 SKMostHydrophobicHydrophilicDistance T_T_T_5 G_S_C_5 |
0.0761(±0.0758) 0.2772(±0.1229) -0.1046(±0.3191) -0.0649(±0.0188) -0.1229(±0.2971) 0.0226(±0.0024) 0.8636(±0.0452) -0.1786(±0.0378) -0.1698(±0.0189) 0.1127(±0.2434) |
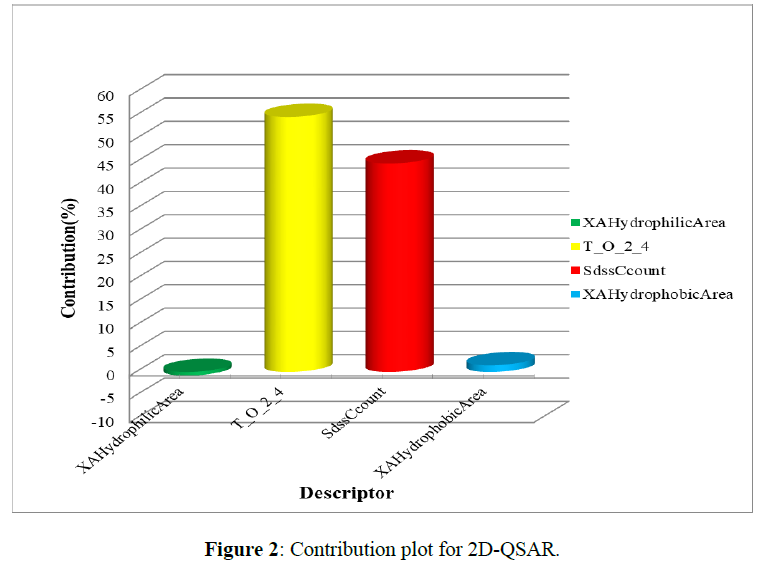
From these two 2D-QSAR models, different Descriptors and their coefficient values are generated in that negative coefficient values of XAHydrophilicArea (vdW surface descriptor showing hydrophilic surface area), SKMostHydrophobicHydrophilicDistance (distance between a most hydrophobic and hydrophilic point on the vdW surface), SssOE-index (Electrotopological state indices for a number of oxygen atom connected with two single bonds.) on the biological activity results in a decrease in Anti-COVID activity. while positive coefficient values of SdssCcount(total number of carbon connected with one double and two single bonds.), XAHydrophobicArea(vdW surface descriptor showing hydrophobic surface area), T_S_2_5(This is the count of a number of sulfur atom separated from any double bond atom by 5 bond distance in a molecule.), T_O_2_4(This is the count of number of Oxygen atoms (single double or triple bonded) separated from double bonded atom by 5 bond distance in a molecule) directily proportional to inhibitory activity on COVID that increases the Anti-COVID activity [10] (Figure 2).
The contribution plot for the Model indicates that the descriptors Sdss C count (44.66%), XAHydrophobic area (1.43%), T_S_2_4 (54.64%) are indicator variable that shows the positive contribution to the QSAR equation respectively to biological activity. XA Hydrophilic Area (0.74%) is an indicator variable that shows a negative contribution.
Above diagram indicates Sdss C count, XA Hydrophobic area, T_S_2_4 are positively contributed for maximum biological activity. Oxygen and carbon with 4 carbon distance is needed for maximum biological activity. Hydrophilicity measns addition of hydroxyl group increases biological activity while XA hydrophobicity means addition of carbon may decreases the biological activity.
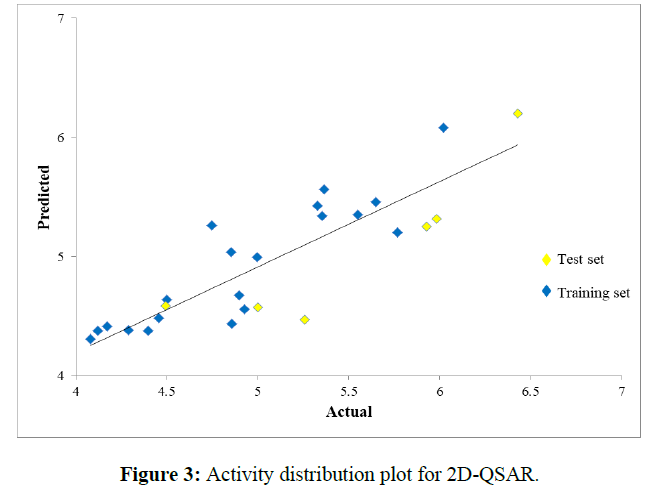
Data activity distribution plot for 2D- QSAR model is the plot of Actual v/s predicted activity gives information about how well the model was trained and how well it predicts the activity of external test set. Activity Distribution plot should contains molecules distributed linearly without crowding at one point indicates Pharmacophore showing good results with biological activity. The given data matches activity distribution plot and shown proper results (Figure 3).
3D-QSAR
By using reference data set, we have calculated steric, hydrophobic, and electrostatic descriptors for given compounds. kNN-MFA is a method of Analysis of 3D-QSAR. The steric, hydrophobic, and electrostatic fields surround a set of Molecules and develop 3D-QSAR models by correlating these 3D fields with the relative biological activities.3D-QSAR optimizes electrostatic, steric, and hydrophobic requirements around the Isatin Pharmacophore. The best model selection is based on the statistical values of q2 >0.5 and pred_r2 >0.5. 3D-QSAR descriptor values were generated that contributed to the k-nearest neighbor molecular field analysis (kNN–MFA) 3D-QSAR model. The statistically significant five 3D-QSAR models are shown in (Table 5) [8].
| Sr. No. | Statistical Data | 3D-QSAR Model | ||||
|---|---|---|---|---|---|---|
| Model 1 | Model 2 | Model 3 | Model 4 | Model 5 | ||
| 1. | k Nearest Neighbour | 2 | 2 | 2 | 3 | 3 |
| 2. | N | 20 | 20 | 20 | 20 | 20 |
| 3. | Degree_of_freedom | 16 | 17 | 17 | 17 | 17 |
| 4. | q2 | 0.6597 | 0.5364 | 0.5389 | 0.7492 | 0.717 |
| 5. | q2_se | 0.4048 | 0.472 | 0.4309 | 0.3063 | 0.3237 |
| 6. | pred_r2 | 0.5226 | 0.6097 | 0.5867 | 0.7072 | 0.5507 |
| 7. | pred_r2se | 0.3846 | 0.365 | 0.5236 | 0.4577 | 0.5723 |
Interpretation of 3D-QSAR models
We have taken multiple trials of 3D-QSAR Analysis and obtained models that show statistical values within a range. Here we have chosen the five best models of kNN MFA analysis (Table 6).
| Model | Selected Descriptor | Coefficient Range |
|---|---|---|
| Model 1 | E_183 E_141 S_427 |
E_183 2.0770 2.4008 E_141 0.0193 0.0418 S_427 -0.5265 -0.4720 |
| Model 2 | S_467 E_184 |
S_467 -0.1217 -0.0827 E_184 1.9566 2.3974 |
| Model 3 | E_91 E_413 |
E_91 0.0954 0.1130 E_413 0.9960 1.2483 |
| Model 4 | E_184 H_92 |
E_184 1.1422 1.4777 H_92 0.1669 0.2788 |
| Model 5 | E_184 H_284 |
E_184 1.1422 1.4777 H_284 0.4110 0.6893 |
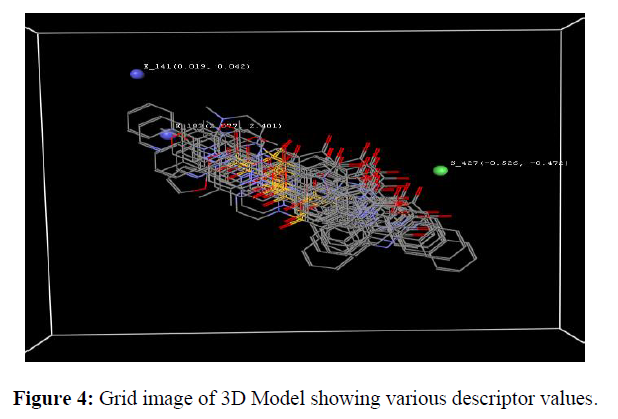
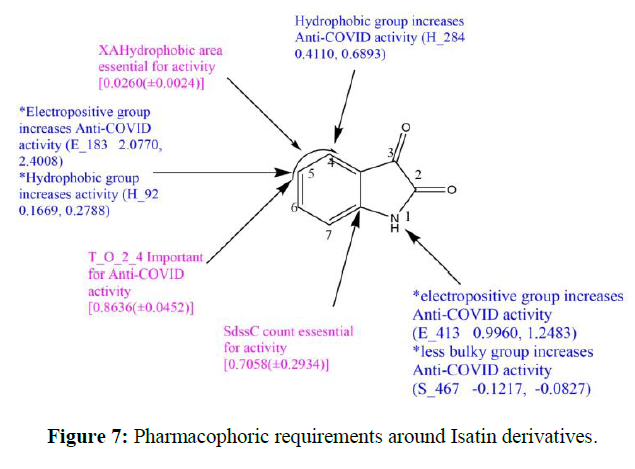
The resulting Grid image shows various points of 3D-QSAR Descriptor contributing to the Model with positive and negative ranges of values surrounding the Isatin derivatives. It shows positions and ranges of the electrostatic, hydrophobic and steric field in models provides information for designing new molecules are as follows:
(a) Electrostatic field, E_183 (2.0770, 2.4008), E_413 (0.9960, 1.2483) has positive value specify that positive electrostatic potential is favorable for activity and hence electropositive substituents are preferred at that position (b) Steric field, S_467 (-0.1217,-0.0827), has a negative value that specifies that negative steric potential is favorable for activity and hence less bulky substituents are preferred at that position.
(c)Hydrophobic field, H_92 (0.1669, 0.2788), H_284 (0.4110, 0.6893) has positive values specify that most hydrophobic groups are favorable for activity and hence most hydrophobic groups are preferred at that position. Grid image showing descriptor and coefficient values are obtained.
3D model of Isatin derivatives were screened through KNN MFA analysis shown E_ 141(0.019, 0.042) and S_427 (-0.526, -0.472) means ionic electron withdrawing group may increases biological activity and hydrophobicity reduces the biological activity (Figure 4).
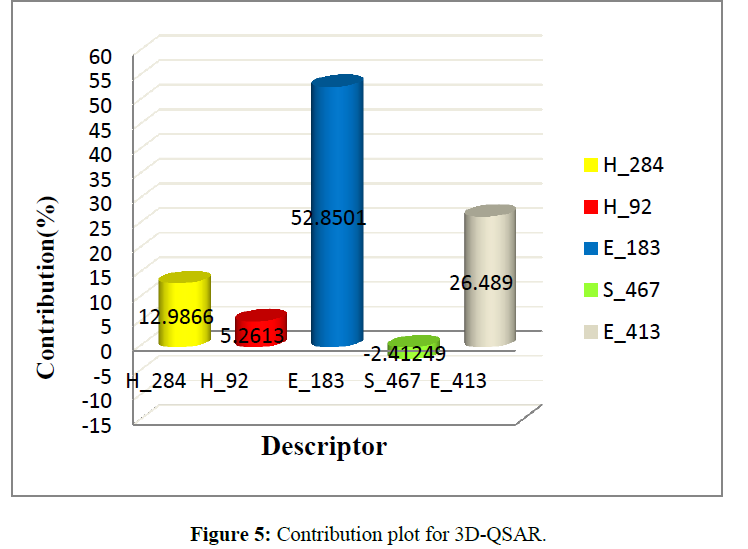
Contribution plot of model is indicates that the descriptors Electrostatic field E_183 (2.0770, 2.4008) contribute 52.85%, E_413 (0.9960, 1.2483) contribute 26.48% And Hydrophobic field H_92 (0.1669, 0.2788) contribute 5.26%, H_284 (0.4110, 0.6893) contribute 12.98%, this are indicator variable which shows positive contribution to the QSAR equation respectively to biological activity. Steric filed, S_467 (-0.1217,-0.0827) contribute 2.41% is indicator variable shows negative contribution (Figure 5).
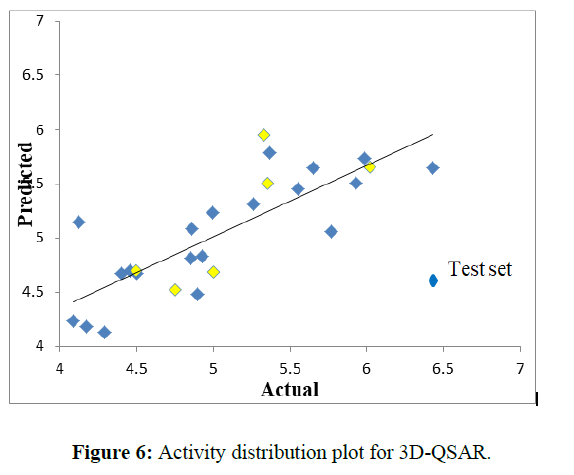
3 D QSAR shown linear plot of activity distribution of all molecules and distributed linearly. Indicates 3 D data shown model validation at this linear activity distribution plot (Figure 6).
Designing of New Chemical Entities (NCEs) Containing Isatin Pharmacophore
In the QSAR study, there are several best models were generated based on statistical values. Various descriptors are obtained from that Model. Isatin Pharmacophore was generated from those descriptors, and several new molecules were designed. This NCE is screened for Physicochemical properties. All the molecules are screened Through the Lipinski Rule of 5 by using SwissADME. From those 50 molecules passes the rule. These listed in the table (Figure 7).
Lipinski rule of five: Molecular weight (MW) was less than or equal to 500 daltons, Lipophilicity log or Moriguchi octane–water partition coefficient (M log P) less than or equal to 5, Hydrogen-bond acceptor (HBA) less than or equal to 10, Hydrogen-bond donor (HBD) less than or equal to 5, Topological polar surface area (TPSA) less than or equal to 150 Å2 (Table 7).
| Sr. No. | Molecule Name | MW | HBA | HBD | MLOGP | TPSA |
|---|---|---|---|---|---|---|
| 1 | 5-(nitromethyl)indoline-2,3-dione | 206.15 | 4 | 1 | -0.8 | 91.99 |
| 2 | (R)-5-(1-nitroethyl)indoline-2,3-dione | 220.18 | 4 | 1 | -0.5 | 91.99 |
| 3 | (R)-5-(1-nitropropyl)indoline-2,3-dione | 234.21 | 4 | 1 | -0.21 | 91.99 |
| 4 | (S)-5-(1-nitrobutyl)indoline-2,3-dione | 248.23 | 4 | 1 | 0.07 | 91.99 |
| 5 | 5-((1S,2R)-2-methyl-1-nitrobutyl)indoline-2,3-dione | 262.26 | 4 | 1 | 0.34 | 91.99 |
| 6 | (S)-5-(2-methyl-1-nitropropyl)indoline-2,3-dione | 248.23 | 4 | 1 | 0.07 | 91.99 |
| 7 | 5-propylindoline-2,3-dione | 189.21 | 2 | 1 | 1.08 | 46.17 |
| 8 | 5-isobutylindoline-2,3-dione | 203.24 | 2 | 1 | 1.36 | 46.17 |
| 9 | 5-sec-butylindoline-2,3-dione | 203.24 | 2 | 1 | 1.36 | 46.17 |
| 10 | 4-methyl-5-propylindoline-2,3-dione | 203.24 | 2 | 1 | 1.36 | 46.17 |
| 11 | 4-methyl-5-(pyridin-2-ylmethyl)indoline-2,3-dione | 252.27 | 3 | 1 | 1.06 | 59.06 |
| 12 | 4-methyl-5-(pyridin-3-ylmethyl)indoline-2,3-dione | 252.27 | 3 | 1 | 1.06 | 59.06 |
| 13 | 4-methyl-5-(pyridin-4-ylmethyl)indoline-2,3-dione | 252.27 | 3 | 1 | 1.06 | 59.06 |
| 14 | 4-methyl-5-(1-(pyridin-4-yl)ethyl)indoline-2,3-dione | 266.29 | 3 | 1 | 1.31 | 59.06 |
| 15 | 5-(1-(pyridin-4-yl)ethyl)indoline-2,3-dione | 252.27 | 3 | 1 | 1.06 | 59.06 |
| 16 | 5-(1-(pyridin-3-yl)ethyl)indoline-2,3-dione | 252.27 | 3 | 1 | 1.06 | 59.06 |
| 17 | 1-methyl-5-(1-(pyridin-3-yl)ethyl)indoline-2,3-dione | 266.29 | 3 | 0 | 1.31 | 50.27 |
| 18 | 1-ethyl-5-(1-(pyridin-3-yl)ethyl)indoline-2,3-dione | 280.32 | 3 | 0 | 1.56 | 50.27 |
| 19 | 1-(2-oxopropyl)-5-(1-(pyridin-3-yl)ethyl)indoline-2,3-dione | 308.33 | 4 | 0 | 0.89 | 67.34 |
| 20 | 2-(2,3-dioxo-5-(1-(pyridin-3-yl)ethyl)indolin-1-yl)acetamide | 309.32 | 4 | 1 | 0.24 | 93.36 |
| 21 | methyl 2-(2,3-dioxo-5-(1-(pyridin-3-yl)ethyl)indolin-1-yl)acetate | 324.33 | 5 | 0 | 0.89 | 76.57 |
| 22 | 2-(2,3-dioxo-5-(1-(pyridin-3-yl)ethyl)indolin-1-yl)acetic acid | 310.3 | 5 | 1 | 0.65 | 87.57 |
| 23 | 1-(2-oxopropyl)-5-(1-(pyridin-3-yl)ethyl)indoline-2,3-dione | 308.33 | 4 | 0 | 0.89 | 67.34 |
| 24 | 5-ethyl-1-(2-oxopropyl)indoline-2,3-dione | 231.25 | 3 | 0 | 0.7 | 54.45 |
| 25 | 1-(2-oxopropyl)-5-propylindoline-2,3-dione | 245.27 | 3 | 0 | 0.96 | 54.45 |
| 26 | 1-methyl-5-propylindoline-2,3-dione | 203.24 | 2 | 0 | 1.36 | 37.38 |
| 27 | 1-methyl-2,3-dioxoindoline-5-carboxylic acid | 205.17 | 4 | 1 | 0.11 | 74.68 |
| 28 | 2,3-dioxoindoline-5-carboxylic acid | 191.14 | 4 | 2 | -0.2 | 83.47 |
| 29 | 5-acetylindoline-2,3-dione | 189.17 | 3 | 1 | -0.14 | 63.24 |
| 30 | 2,3-dioxoindoline-5-carbaldehyde | 175.14 | 3 | 1 | -0.45 | 63.24 |
| 31 | 1-ethyl-2,3-dioxoindoline-5-carbaldehyde | 203.19 | 3 | 0 | 0.15 | 54.45 |
| 32 | 2,3-dioxo-1-propylindoline-5-carbaldehyde | 217.22 | 3 | 0 | 0.43 | 54.45 |
| 33 | 2,3-dioxo-1-propylindoline-5-carboxamide | 232.24 | 3 | 1 | 0.27 | 80.47 |
| 34 | 4-methyl-2,3-dioxo-1-propylindoline-5-carboxamide | 246.26 | 3 | 1 | 0.54 | 80.47 |
| 35 | 1-methyl-2,3-dioxo-4-propylindoline-5-carboxamide | 246.26 | 3 | 1 | 0.54 | 80.47 |
| 36 | 4-isopropyl-1-methyl-2,3-dioxoindoline-5-carboxamide | 246.26 | 3 | 1 | 0.54 | 80.47 |
| 37 | 1-ethyl-4-isopropyl-2,3-dioxoindoline-5-carboxamide | 260.29 | 3 | 1 | 0.81 | 80.47 |
| 38 | 4,5-dimethylindoline-2,3-dione | 175.18 | 2 | 1 | 0.79 | 46.17 |
| 39 | 3-(2,3-dioxoindolin-5-yl)propane-1-sulfonic acid | 269.27 | 5 | 2 | 0.05 | 108.92 |
| 40 | 3-(1-methyl-2,3-dioxoindolin-5-yl)propane-1-sulfonic acid | 283.3 | 5 | 1 | 0.33 | 100.13 |
| 41 | 3-(1,4-dimethyl-2,3-dioxoindolin-5-yl)propane-1-sulfonic acid | 297.33 | 5 | 1 | 0.6 | 100.13 |
| 42 | 5-cyclohexyl-1,4-dimethylindoline-2,3-dione | 257.33 | 2 | 0 | 2.4 | 37.38 |
| 43 | 1-methyl-5-(trifluoromethyl)indoline-2,3-dione | 229.16 | 5 | 0 | 1.49 | 37.38 |
| 44 | 1,4-dimethyl-5-(trifluoromethyl)indoline-2,3-dione | 243.18 | 5 | 0 | 1.77 | 37.38 |
| 45 | 4-ethyl-1-methyl-5-(trifluoromethyl)indoline-2,3-dione | 257.21 | 5 | 0 | 2.03 | 37.38 |
| 46 | 4-isopropyl-1-methyl-5-(trifluoromethyl)indoline-2,3-dione | 271.24 | 5 | 0 | 2.29 | 37.38 |
| 47 | 4-isopropyl-1-methyl-5-(2,2,2-trifluoroethyl)indoline-2,3-dione | 285.26 | 5 | 0 | 2.28 | 37.38 |
| 48 | 4-isopropyl-1-methyl-5-(2,2,2-trifluoroethyl)indoline-2,3-dione | 299.29 | 5 | 0 | 2.53 | 37.38 |
| 49 | 1,4-dimethyl-5-(1,1,1-trifluoropropan-2-yl)indoline-2,3-dione | 271.24 | 5 | 0 | 2.03 | 37.38 |
| 50 | 1-isopropyl-5-(trifluoromethyl)indoline-2,3-dione | 257.21 | 5 | 0 | 2.03 | 37.38 |
MOLECULAR DOCKING STUDY
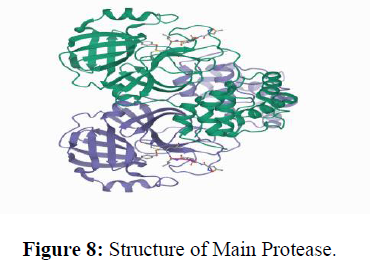
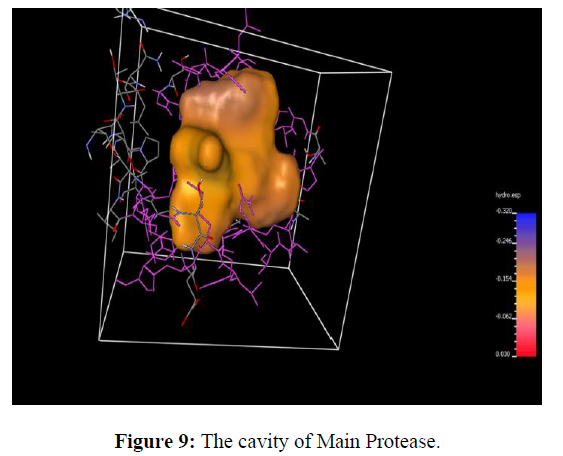
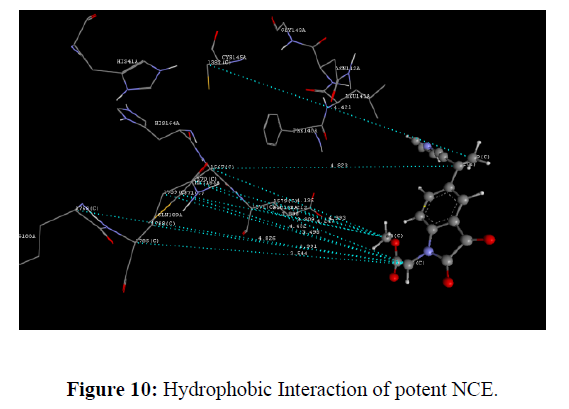
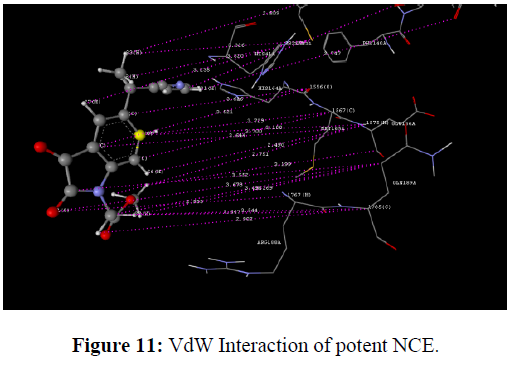
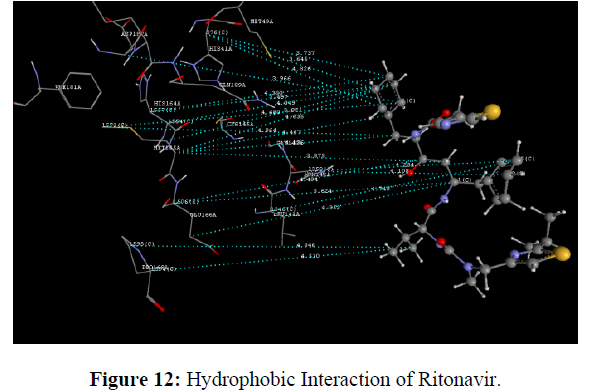
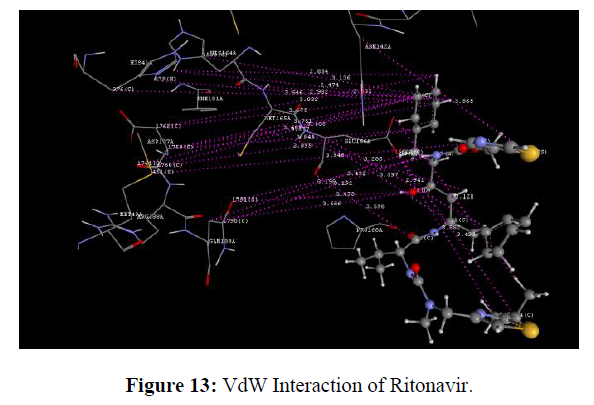
The docking study was performed using the VLife MDS 4.3. Software Designed NCEs screened for drug-likeness were docked to sort out the designed compounds with good binding affinity against the Main protease (PDB ID: 6lu7) (Figure 8). GRIP docking is the type of docking that shows various interactions of drug molecules with the Binding site of enzyme with a Dock score in kcal/mol. Isatin derivatives were docked with the active site of the enzymes Main protease (PDB ID: 6lu7), which showed better docking scores than Ritonavir reference standard drug molecule (dock score -14.694 kcal/mol) (Figure 9). Compounds methyl 2-(2, 3-dioxo-5-(1-(pyridin-3-yl) ethyl) indolin-1-yl) acetate showed good docking score -76.040 kcal/mol with Main protease enzyme. Compounds methyl 2-(2, 3-dioxo-5-(1-(pyridin-3-yl) ethyl) indolin-1-yl) acetate showed hydrophobic interaction with Amino acid (CYS145A, MET165A, GLU166A, ARG188A, GLN189A), [11] Vander Waals interaction with Amino acid (HIS41A, PHE140A, LEU141A, ASN142A, GLY143A, CYS145A, HIS164A, MET165A, GLU166A, ARG188A, GLN189A)whereas the reference compound Ritonavir showed hydrophobic interactions with Amino acid (HIS41A, LEU141A, ASN142A, HIS164A, MET165A, GLU166A, PRO168A, ASP187A, ARG188A, GLN189A), Vander Waals interactions with Amino acids (HIS41A, MET49A, ASN142A, GLY143A, CYS145A, HIS164A, MET165A, GLU166A, ASP187A, GLN189A), H-bond interaction With Amino acid(GLN189A) and Charge interactions with Amino acid (HIS41A, LEU144A, ASN142A, HIS164A, MET165A, GLU166A, PHE181A, ASP187A, ARG188A, GLN189A) these Various interactions are shown in the figure (Table 8) (Figure 10-14) .
| MOLECULE | DOCKSCORE Kcal/mol |
MOLECULE | DOCKSCORE Kcal/mol |
|---|---|---|---|
| 1 | -53.094 | 27. | -46.832 |
| 2 | -55.458 | 28. | -52.924 |
| 3 | -52.832 | 29. | -50.823 |
| 4 | -69.227 | 30. | -50.745 |
| 5 | -50.182 | 31. | -57.606 |
| 6 | -53.120 | 32. | -60.490 |
| 7 | -50.312 | 33. | -59.504 |
| 8 | -53.027 | 34. | -55.321 |
| 9 | -54.111 | 35. | -55.395 |
| 10 | -50.955 | 36. | -58.581 |
| 11 | -62.261 | 37. | -55.122 |
| 12 | -62.241 | 38. | -50.560 |
| 13 | -61.353 | 39. | -47.132 |
| 14 | -60.732 | 40. | -50.797 |
| 15 | -52.665 | 41. | -54.270 |
| 16 | -53.283 | 42. | -67.074 |
| 17 | -57.271 | 43. | -58.170 |
| 18 | -70.466 | 44. | -57.380 |
| 19 | -75.363 | 45. | -61.562 |
| 20 | -73.509 | 46. | -62.437 |
| 21 | -76.040 | 47. | -61.258 |
| 22 | -72.006 | 48. | -56.199 |
| 23 | -75.363 | 49. | -63.793 |
| 24 | -50.619 | 50. | -51.185 |
| 25 | -60.592 | Ritonavir | -14.694920 |
| 26 | -57.577 |
Standard Ritonavir shown VdW means vander walls of interaction with enzyme main protease and shown more VdW interaction with receptor as per the diagram
Conclusion
Through a QSAR approach, a potential compound with Anti-COVID activity containing Isatin derivatives developed. Isatin Pharmacophore is designed using various 2D and 3D-QSAR descriptors present around the parent molecule. 2D-QSAR descriptors T_O_2_4, XAHydrophobicarea, SdssCcount, are the variables that increase biological activity, and the XAHydrophilicArea indicator variable leads to a decrease in biological activity concerning the QSAR equation. The 3D-QSAR study suggested the important Substituent required for an Anti-COVID activity like Electropositive Substituent at 1st and 5th position, less steric Substituent on 1st position, and the more hydrophobic Substituent at 4th and 5th position from the Isatin Pharmacophore NCE designed that are screened through Lipinski rule of 5 for drug-likeness. Designed NCE shows good binding interaction with the Main protease (PDB ID: 6lu7) enzyme. NCE methyl 2-(2,3-dioxo-5-(1-(pyridin-3-yl)ethyl)indolin-1-yl)acetate show potent activity with dock score -76.040 kcal/mol more than reference molecule ritonavir dock score -14.694 kcal/mol. It concluded that Isatin derivatives are useful for new drug development against COVID 19.
REFERENCES
- Shah A, Rashid F, Aziz A et al., Gene Reports. 2020, 21: p.100886.
- Mousavizadeh L. and Ghasemi S. J. Microbiol Immunol Infect. 2021, 54: pp.159-163.
- De Maio F, Cascio EL, Babini et al., Microbes and infection. 2020, 22: pp.592-597.
- Liu W, Zhu HM, Niu GJ et al., Bioorganic & medicinal chemistry. 2014, 22: pp.292-302.
- Asgaonkar KD, Mote GD and Chitre TS. Scientia pharmaceutica. 2014, 82: pp.71-86.
- Lima MN, Melo-Filho CC, Cassiano GC et al., Frontiers in pharmacology. 2018, 9: p.146.
- Pagare AH, Kankate RS and Shaikh AR. J Curr Pharm Res. 2015, 5: p.1473.
- Vyas VK, Ghate M and Katariya H. Organic and medicinal chemistry letters. 2011, 1: pp.1-11.
- Noolvi MN and Patel HM. J basic clin pharm. 2010, 1: p.153.
- Vlifescience. https://www.vlifesciences.com/. 2021
- Bergmann CC and Silverman RH. Cleveland Clinic journal of medicine. 2020, 87: pp.321-327.
Indexed at , Google Scholar , Crossref
Indexed at , Google Scholar , Crossref
Indexed at , Google Scholar , Crossref
Indexed at , Google Scholar , Crossref
Indexed at , Google Scholar , Crossref
Indexed at , Google Scholar , Crossref
Indexed at , Google Scholar , Crossref

