Research Article - Der Pharma Chemica ( 2024) Volume 16, Issue 6
Impurities Profiling of Method Development and Validation of Etravirine (ETR) in their Dosage Forms by Chromatography Method as Per International Conference on Harmonisation Guidelines
Nirav R. Soni1* and Pragnesh Patani22Department of Pharmaceutics, Khyati Pharmacy College, GTU, Ahmedabad, India
Nirav R. Soni, Department of Pharmaceutics, Gujarat Technological University, Gujarat, India, Email: nirav_sonic@yahoo.com
Received: 28-Oct-2024, Manuscript No. DPC-24-151341; Editor assigned: 31-Oct-2024, Pre QC No. DPC-24-151341 (PQ); Reviewed: 14-Nov-2024, QC No. DPC-24-151341; Revised: 01-Dec-2024, Manuscript No. DPC-24-151341 (R); Published: 29-Dec-2024, DOI: 10.4172/0975-413X.16.6.524-530
Abstract
Objective: An accurate, precise, rapid and economical reverse phase High Performance Liquid Chromatography (HPLC) method has been developed and validated for the estimation of etravirine in pharmaceutical dosage forms, using PDA detector.
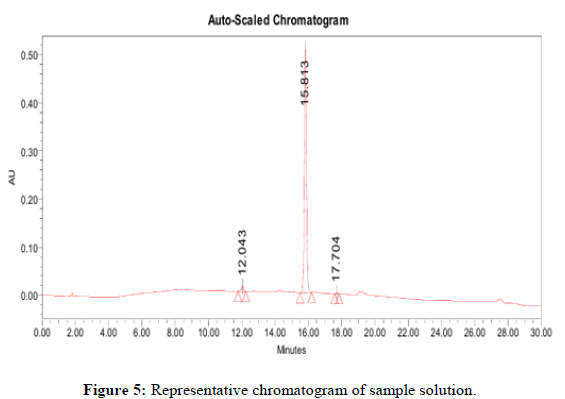
Method: Elution was carried out using a mobile phase-A and B consisting of HPLC grade and flow rate was set on 1 ml/minute at 310 nm wave length. The retention time for Etravirine (ETR), impurity-1 and impuriey-2 was found to be 15.813, 12.043 and 17.704 respectively minutes.
Result: Analytical method was developed using HPLC Shimadzu (with power stream) gradient chromatographic technique. Data were passed through the spinchrom software. Separation was achieved on Xselect HSS T3 (150 × 4.6 mm, 3.5 μm) column and using mobile phase A (Buffer) was used at pH 4.0 and mobile phase B (Methanol: Acetonitrile: Water (90:5:5 v/v)) by gradient programme. Flow rate was maintained at 1 ml/min with 310 nm PDA detection. The Retention Time (RT) obtained for Etravirine (ETR), impurity 1 and impurity 2 was at 15.813 min, 12.043 min and 17.704 min respectively with injection volume 10 μL and the detection was made at 310 nm. The % recovery of impurity-1 and impurity-2 observed was above 90% from LOQ level to 150%. The correlation coefficient r2 was 0.9993 for impurity-1 and 0.9997 for impurity-2. The method was found unaffected by change in method variance during the robustness study. During the stress study with acid, base, peroxide and temperature, maximum degradation was observed with peroxide indicating the sensitivity of the molecule toward oxidative stress.
Conclusion: The developed method is precise, accurate, robust and linear and hence can be routinely used for the related substance analysis of metformin hydrochloride and teneligliptin hydrobromide hydrate tablet in the quality control laboratory at manufacturing site during the commercial manufacturing. Results of all validation parameter were within the limits as per International Conference on Harmonization (ICH) guideline.
Keywords
Reverse Phase High Performance Liquid Chromatography (RP-HPLC); Etravirine (ETR); Method development and validation
Introduction
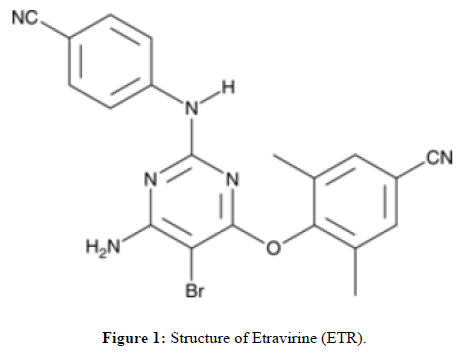
Etravirine (ETR) is a non-nucleoside reverse transcriptase inhibitor used to treat HIV-1, approved by the FDA for its efficacy against the virus [1,2]. It is chemically classified as a 4-[[6-amino-5-bromo-2[(4-cyanophenyl)-amino] pyrimidinyl] oxy]-3,5-dimethylbenzonitrile and belongs to BCS Class IV due to its low solubility and permeability. Literature survey reveals that analytical methods for ETR are limited, with only three High-Performance Liquid Chromatography (HPLC) methods available and it being listed in the USP Draft-2023 [3-5]. The brand of this molecule mainly intelence. Existing literature shows a lack of comprehensive methods for analyzing ETR and its impurities, with only one study addressing force degradation impurities and detecting seven, two of which are noted in the USP draft. There is a need for a method to identify both known and unknown impurities, particularly those causing toxicity. The aim of the study is to develop a simple and accurate RP-HPLC method for routine ETR analysis (Figure 1 and Table 1).
| Name | Impurity-1 | Impurity-2 |
|---|---|---|
| Marketed Name | 3- amino bromo | Des amino impurity |
| IUPAC name | 4-((4-Amino-5-bromo-6-chloropyrimidin-2-yl)amino)benzonitrile | 4-((5-Bromo-2-((4-cyanophenyl)amino)pyrimidin-4-yl)oxy)-3,5-dimethylbenzonitrile |
| CAS no | 1398507-09-9 | 269055-04-1 |
| Molecular structure |  |
 |
| Molecular formula | C11H7BrClN5 | C20H14BrN5O |
| Molecular weight | 324.6 | 420.26 |
Table 1: Taken impurities in this method development and validation process throughout the project.
Materials and Methods
Standard drugs and its impurities
Etravirine was procured from the HETERO Pharma and its impurities 1 and 2 were procured from Acun pharm life science, Ahmedabad. All impurities and ETR standard are of >97 % purity and as follows: Etravirine (99.6%), impurity-1 (97.8%), impurity-2 (98.2 %).
Chemical and reagents
Methanol (Finer chemical Ltd.), acetonitrile (Rankem chemicals), purified water (Rankem chemicals).
Instruments
HPLC Shimadzu (with power stream), column: Xselect HSS T3 (150 × 4.6 mm, 3.5 μm), pH meter (Systronics PH361), pump: LC-20 AT, syringe: Rheodyne injector valve with 20.0 μl loop, digital balance (Mettler Toledo ML 204), glass wares (Borosil), ultrasonicator (Toshcon), melting point apparatus (Supertek), software: Spinchrom.
Experimental works
Preparation of stock solution: Weigh accurately about 7 mg of ETR standard into a 10 ml volumetric flask, add about 4 ml-5 ml of diluent and sonicate to dissolve. Make up to the mark diluent and mix well. Dilute 100 μl (0.1 ml) of the above solution into a 100 ml volumetric flask. Make up to the mark with diluent and mix well.
Preparation of impurity-1 stock solution: Weigh accurately about 7 mg of impurity-1 into a 10 ml volumetric flask, add about 4-5 ml of diluent and sonicate to dissolve and make up to the mark with diluent and mix well
Preparation of impurity-2 stock solution: Weigh accurately about 7 mg of impurity-2 into a 10 ml volumetric flask, add about 4-5 ml of diluent and sonicate to dissolve and make up to the mark with diluent and mix well.
LOD solution preparation: Transferred 2.3 μl impurity-1 stock solution, 1.4 μl impurity-2 stock solution and 1.0 μl of standard stock solution into a 100 ml volumetric flask containing 50 ml of diluent, mixed well and diluted to volume with diluent and mixed well (Tables 2-4 and Figures 4-7).
Preparation of mobile phase
Buffer: First filter 1000 ml of Milli-Q-water through 0.45 μm nylon membrane filter paper and transfer accurately 1.0 ml of perchloric acid (70%). Mix well and sonicate to degas.
Mobile phase A: Buffer
Mobile phase B: Methanol: Acetonitrile: Water (90:05:05 v/v/v)
| Time (in mins) | 0 | 10 | 22 | 35 | 35.5 | 42 |
| Mobile phase-A (%) | 30 | 30 | 5 | 5 | 30 | 30 |
| Mobile phase- B (%) | 70 | 70 | 95 | 95 | 70 | 70 |
Table 2: Gradient programme.
| Column | Xselect HSS T3 (150 × 4.6 mm, 3.5 μm) |
| Wavelength | 310 nm |
| Column temperature | 35°C |
| Injection volume | 10 µl |
| Run time | 30 minutes |
| Diluent | Methanol: Acetonitrile (50:50 v/v) |
| Needle wash | Diluent |
| Elution | Gradient |
| Sample concentration | 0.7 mg/ml |
Table 3: Optimized chromatographic conditions.
| Sr. No | Solution Name | No. of injections |
|---|---|---|
| 1 | Diluent as blank | Confirm neat blank |
| 2 | SST solution | 1 |
| 3 | Diluent as blank | Confirm neat blank |
| 4 | Reference solution | 6 |
| 5 | Sample solution preparation-01 | 1 |
| 6 | Sample solution preparation-02 | 1 |
| 7 | SST solution | 1 |
| 8 | Diluent as blank | Confirm neat blank |
| 9 | Reference solution | Confirm neat blank |
Table 4: Order of injections.
Method validation
The developed HPLC method for analysing etravirine was validated according to ICH Q2 guidelines. The validation covered several parameters, including system suitability, specificity (selectivity and forced degradation), sensitivity (LOD and LOQ), linearity, precision, accuracy, filter study, stability of analytical solutions and robustness. The method was specifically validated for etravirine in bulk form, focusing on impurities 1 and 2.
System suitability
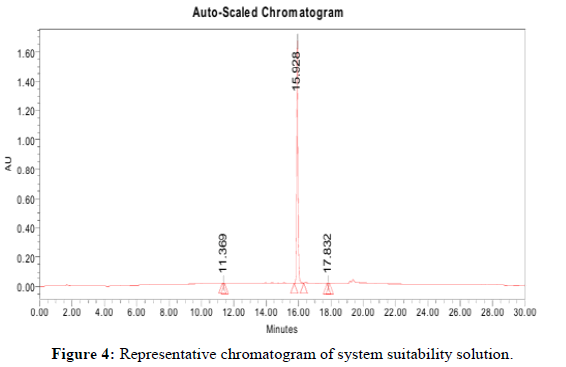
The system suitability tests must meet the following acceptance criteria for first and last injection concentration. System suitability criteria for development of a robust analytical method, we have defined the system suitability parameters like resolution, capacity factor, signal-to-noise ratio, theoretical plates, etc. Considering the long run time and solution stability issue, similarity factor was estimated by injecting the two standard solutions (standard solutions 1 and 2).
Resolution between any two known impurities and main peak should not be less than 1.5
Number of theoretical plates for Etravirine (ETR) peak: Not less than 3000
Tailing factor for Etravirine (ETR) Peak: NMT 2.0
Reference solution preparation/standard preparation
Weigh accurately about 7 mg of ETR standard into a 10 ml volumetric flask, add 4-5 ml of diluent and sonicate to dissolve. Make up to the mark with diluent and mix well. Dilute 100 μl (0.1 ml) of above solution into a 100 ml volumetric flask. Make up to the ark with diluent and mix well.
Linearity (Calibration curve)
Level solutions: To determine accuracy, three concentrations of the analyte-50%, 100% and 150% were prepared and chromatograms recorded. Six preparations at the Limit of Quantification (LOQ) and three each at 50%, 100% and 150% levels were injected into the system. The recovery percentages for each impurity and the principal analyte peak were calculated. The recovery limits were set at 80%-120% for LOQ and 85%-115% for other levels. Acceptance criteria included meeting system suitability standards, ensuring that the relative standard deviation (RSD) for impurity peak areas and the ETR peak area did not exceed 5.0% and that the regression coefficient for each impurity was at least 0.99 with a Y-intercept within ± 5.0% [6,7].
Determination of Limit of Detection (LOD) and Limit of Quantification (LOQ)
The limit of detection and limit of quantification of the impurities were determined by calculating the Signal-to-Noise Ratio (S/N, i.e., 3.3 for LOD and 10 for LOQ) using the following equations designated by International Conference on Harmonization (ICH).
LOD=3.3 × σ/S
LOQ=10 × σ/S
Where σ=standard deviation
Precision: The precision was demonstration under three categories.
System precision: The precision was demonstration under three categories. System precision single individual preparation of ETR drug substance was prepared with target concentration of about 0.1 mg/ml for system precision [8-10].
Method precision: The precision was demonstrated under three categories. For system precision, the standard solution was prepared and six replicate injections 10 μl of above preparation into the chromatographic system and the area was measured for all six injections in HPLC. The %RSD for the area of six replicate injections was found to be within the specified limits and for ruggedness six individual preparations of ETR drug substance with impurities were prepared and analyzed by different analysis systems, columns and in different days under similar conditions at different time.
Intermediate precision (Ruggedness): Demonstration of ruggedness was conducted by different analysts, systems, columns and in different days under similar conditions at different times. Six individual preparations of ETR drug substance spiked with impurities were prepared and each was analyzed.
Selectivity: The specificity of the method was demonstrated by interference check by injecting the diluent blank, ETR and impurities solutions to determine whether any peaks in the diluent and impurities solutions are co-eluting with ETR peaks.
Forced degradation study: A forced degradation study was conducted to assess the selectivity and stability indicating nature of the method. Samples and placebos were subjected to various stress conditions: acid degradation with 0.5 N hydrochloric acid at 60°C for 2 hours, alkali degradation with 1 N sodium hydroxide at room temperature for 5 hours, thermal degradation at 80°C for 2 days, oxidative stress with 0.3% hydrogen peroxide for 12 hours and photolytic degradation by exposing the sample to 1.2 million lux hours at 200 Wh/sq. These stressed samples were then analyzed using RP-HPLC.
LOD and LOQ determination: Series of known impurity solutions were prepared over a range starting from 1% to 50% of the working concentration and injected in triplicates. The linearity graph was plotted for average area at each level against the concentration in ppm. The correlation coefficient, slope and intercept were determined for each known impurity [11-15].
Precision at LOQ level: Six solutions were prepared by spiking the ETR working standard along with all the known impurities at LOQ level in the placebo. The % RSD of peak area and % results were calculated.
Linearity and range: Linearity of the analytical method for assay by injecting the linearity solutions prepared in the range of 10 μg-60 μg (25%-200%) of test concentration, into the chromatograph, covering minimum six different concentrations.
Solution stability: The stability of the solutions was tested over 48 hours by injecting 10 μl of the standard solution into the chromatographic system at 0, 24 and 48 hours. The peak areas were recorded and the Relative Standard Deviation (RSD) of these peak areas was calculated. The acceptance criteria required that the system suitability pass under variable conditions and that the %RSD for the peak area of ETR not exceed 2.0%.
Filter validation study: A filter validation study was performed to ensure that the molecule and its impurities did not interact with or get adsorbed by the filters used during sample and standard preparation. This is important because such interactions can lead to inconsistent results. The study involved filtering the sample solution through 0.45 μm porosity Nylon (MDI, India) and PVDF (Merck Millipore, Germany) filters, discarding the initial 2 ml, 3 ml and 5 ml of filtrate to optimize the filtration process for accurate results.
Robustness: As part of the robustness, deliberate change in the temperature and flow rate variation was made to evaluate the impact on the method. This study was conducted by intentionally altering the critical method parameters like flow rate, change pH, change in column temperature and change in gradient composition. The diluent, standard solution, sample solution and impurity spiked sample solution were injected to check the robustness of analytical method.
Results and Discussion
The developed method was validated as per ICH guide line Q2B (R1)
Impurities stock solution preparation: Weigh accurately each impurity about 7 mg (Impurity-1 and Impurity-2) into a 50 ml volumetric flask, add about 25-30 ml of diluent and sonicate to dissolve and make up to the mark with diluent and mix well.
Accuracy: The developed method was found capable to recover the contents accurately when spiked at 50% to 150% of the working concentration. The obtained results in % as well as μg/ml are summarized in Tables 5 and 6.
| Analytes name | Recovery at LOQ | Recovery at 50% | Recovery at 100% | Recovery at 150% |
|---|---|---|---|---|
| ETR | 90.8 | 98 | 99.4 | 98.9 |
| Impurity-1 | 97.5 | 98.4 | 102.6 | 97.9 |
| Impurity-2 | 97.1 | 99.6 | 107.8 | 103.9 |
| Acceptance criteria | The % recovery for the area of known impurity should be between 70-130 | |||
Table 5: Study results in % recovered.
| Analytes name | Recovery in µg/ml at LOQ | Recovery in µg/ml at 50% | Recovery in µg/ml at 100 % | Recovery in µg/ml at 150 % | ||||
|---|---|---|---|---|---|---|---|---|
| Added | Recovered | Added | Recovered | Added | Recovered | Added | Recovered | |
| ETR | 0.215 | 0.195 | 1.076 | 1.054 | 2.147 | 2.138 | 3.324 | 3.19 |
| Impurity-1 | 0.223 | 0.217 | 1.108 | 1.088 | 2.21 | 2.265 | 3.315 | 3.245 |
| Impurity-2 | 0.225 | 0.209 | 1.074 | 1.073 | 2.147 | 2.313 | 3.218 | 3.332 |
Table 6: Recovery study results in µg/ml.
Precision: The % similarity factor for standard 1 and standard 2 was found between 95 and 105% during the complete validation study.
System precision: Single individual preparation of ETR drug substance was prepared with target concentration of about 0.1 mg/ml for system precision (Table 7).
| No. of injections | Area (mV*s) |
|---|---|
| 1 | 25698.52 |
| 2 | 25391.26 |
| 3 | 25397.9 |
| 4 | 25024.67 |
| 5 | 25461.67 |
| Average | 25394.8 |
| SD | 241.731 |
| % RSD | 0.952 |
Table 7: System precision.
Method precision: The % RSD of known impurities, single maximum and total impurities was found to be less than 15% from six sample preparations during the method and intermediate precision study.
Intermediate precision (Ruggedness): The acceptance criteria for system, method and intermediate precision were that the system suitability criteria should be meet and the % RSD for the peak area of ETR in reference solution from the six replicate injections should NMT be 5.0%. The % Relative standard deviation for the peak area of each impurity should NTM 5.0 and for ETR should NMT 2.0 %. The data are reported in Table 8.
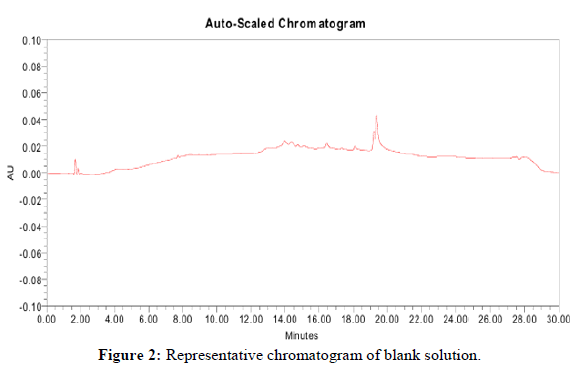
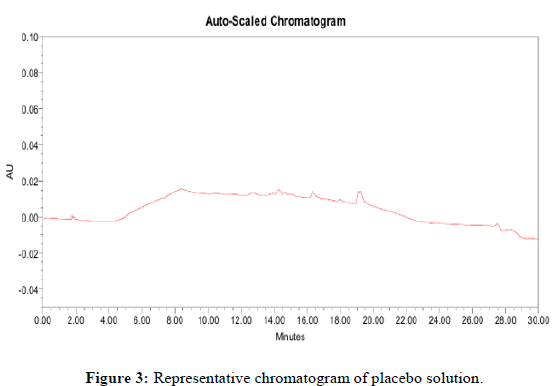
Selectivity: No interference was observed at the retention time of known impurities and principle analyte peaks from blank and placebo solution. All the peaks were properly resolved from each other.
LOD and LOQ determination: The LOD and LOQ values of ETR impurities-1 and 2 were found to be 0.001, 0.002, 0.001 μg/ml and 0.005, 0.005, 0.005 respectively.
| Method precision | Intermediate precision (Ruggedness) | |||||
|---|---|---|---|---|---|---|
| No. of injections | Area (mV*s) | Area (mV*s) | ||||
| ETR | Impurity-1 | Impurity-2 | ETR | Impurity-1 | Impurity-2 | |
| 1 | 25718.42 | 25.17 | 23.49 | 25325.23 | 22.48 | 21.47 |
| 2 | 25790.36 | 25.48 | 23.44 | 25212.41 | 22.27 | 22.3 |
| 3 | 25229.31 | 25.28 | 24.34 | 25118.21 | 22.9 | 21.5 |
| 4 | 25942.03 | 25.41 | 23.99 | 25675.62 | 22.05 | 21.56 |
| 5 | 25295.36 | 25.53 | 23.86 | 25271.76 | 22.41 | 21.78 |
| 6 | 25973.37 | 25.78 | 23.83 | 25696.03 | 22.53 | 22.15 |
| Average | 25658.14 | 25.44 | 23.16 | 25383.21 | 22.44 | 21.793 |
| SD | 321.429 | 0.212 | 23.77 | 244.352 | 0.284 | 0.355 |
| %RSD | 1.253 | 0.833 | 0.416 | 0.963 | 1.265 | 1.628 |
Table 8: Method precision and intermediate precision study.
Conclusion
A simple isocratic reverse phase High-Performance Liquid Chromatography (RP-HPLC) method was developed and validated for detecting impurities in Etravirine (ETR). Following ICH Q2 (R1) guidelines, the method was tested for system suitability, precision, linearity, specificity, stability, robustness and limits of detection and quantitation. Utilizing an Xselect HSS T3 column and a PDA detector at 310 nm, the method achieved clear separation of ETR from impurities with a retention time of approximately 15.813 minutes. It demonstrated precision, sensitivity, accuracy and efficiency, making it suitable for routine quality control and stability studies. The method effectively identifies impurities at low levels and is both eco-friendly and cost-effective, with minimal use of hazardous chemicals and organic solvents. It supports accurate impurity testing in pharmaceutical manufacturing and aids researchers by saving development time and cost.
References
- Ahamed A, Krishnamurthy, Bhojya naik H, et al. Int J Pharm Pharmaceu Sci. 2012; 4 (1): P. 255-261.
- Quaranta S, Woloch C, Paccou A, et al. Ther Drug Monit. 2009; 31(6): p. 695-702.
[Crossref] [Google Scholar] [PubMed]
- Ramesh K, Shekar BC, Khadgapathi PO. Int J Pharm Pharm Sci. 2015;7(4): p. 98-103.
- Bhattacharyya S, Adhikari H, Regmi D, et al. Indian J Pharm Sci. 2022; 84(3): p. 575-585.
- Punugoti RA, Jupally VR. Int J Pharm Bio Sci. 2013; 3: p. 515-522.
- Barath M, Chandan RS, Maruthi R, et al. Res J Pharm Technol. 2021; 14(7): p. 3537-3542.
- Satyanarayana L, Naidu SV, Rao MN, et al. Asian J Sci Res. 2011; 4(10): p. 1649-1651.
- Murali D, Venkatrao SV, Rambabu C. Am J Anal Chem. 2014; 5(02): 77.
- Godinho AL, Martins IL, Nunes J, et al. Eur J Pharm Sci. 2018; 119: p. 70-82.
[Crossref] [Google Scholar] [PubMed]
- Belkhir L, De Laveleye M, Vandercam B, et al. Clin Biochem. 2016; 49(7-8): p. 580-586.
[Crossref] [Google Scholar] [PubMed]
- Rezk NL, White NR, Jennings SH, et al. Talanta. 2009; 79(5): p. 1372-1378.
[Crossref] [Google Scholar] [PubMed]
- Blakney AK, Jiang Y, Whittington D, et al. J Chromatogr B. 2016; 1025: p. 110-118.
[Crossref] [Google Scholar] [PubMed]
- Rajput L, Sanphui P, Desiraju GR. Crys Growth Des. 2013; 13(8): p. 3681-3690.
- Rojekar S, Vora LK, Tekko IA, et al. Eur J Pharm Biopharm. 2021; 165: p. 41-51.
[Crossref] [Google Scholar] [PubMed]
- Scholler-Gyure M, Kakuda TN, Raoof A, et al. Clin Pharmaco. 2009; 48: p. 561-574.
[Crossref] [Google Scholar] [PubMed]

