Research Article - Der Pharma Chemica ( 2022) Volume 14, Issue 7
HPTLC Method for the Estimation of Buclizine Hydrochloride (BUC) From Pure and Tablet Dosage Form
Moreshwar P Mahajan and Arun M. Kashid*Arun M. Kashid, Department of Pharmaceutical Chemistry, Sinhgad Technical Education Society, Sinhgad Institute of Pharmacy, Narhe, Pune 411041, India, Email: arunkashid2006@gmail.com
Received: 23-Jun-2022, Manuscript No. dpc-22-67542; Editor assigned: 25-Jun-2022, Pre QC No. dpc-22-67542; Reviewed: 09-Jul-2022, QC No. dpc-22-67542; Revised: 12-Jul-2022, Manuscript No. dpc-22-67542; Published: 19-Jul-2022, DOI: 10.4172/0975-413X.14.7.49-55
Abstract
A simple, selective, accurate, and precise High-Performance Thin-Layer chromatographic (HPTLC) method has been developed and validated for analysis of the Buclizine Hydrochloride (BUC) in bulk drug and pharmaceutical formulations. HPTLC was performed on aluminium sheets precoated with silica gel G 60F254 as a stationary phase. The mobile phase chosen for development consists of chloroform: ethyl acetate in the ratio of 8:2 (v/v). Buclizine Hydrochloride (BUC) showed good linear regression analysis over the concentration ranges 100-600 ng per spot with correlation coefficients (R2) = 0.999. The developed method was validated as per ICH guidelines for precision, recovery, robustness, and specificity. The developed method can be applied for the quality control of commercial samples of Buclizine Hydrochloride (BUC) API and its different formulations.
Keywords
Buclizine hydrochloride (BUC); HPTLC; Method Development
INTRODUCTION
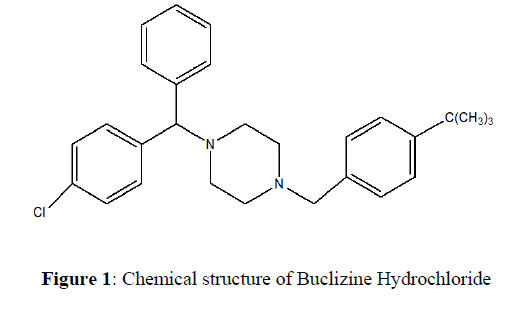
Buclizine Hydrochloride (BUC), (RS)-1-(4-tert-butylbenzyl)-4-(4-chlorobenzhydryl) piperazinedihydrochloride is a piperazine derivative having antihistaminic, antimuscarinic, antiemetic and moderate sedative properties. Buclizine hydrochloride is an anticholinergic that reduces labyrinth excitability and diminishes vestibular stimulation of the labyrinth, affecting the chemoreceptor trigger zone (CTZ) possesses anticholinergic activity (Figure 1). BUC, like its analog meclizine, is mainly used in the prevention of motion sickness, nausea, and vomiting with analgesics in the treatment of migraine and as an appetite stimulant. This drug has also been used in the treatment of vertigo associated with disorders of the vestibular system, although its value in these conditions remains to be established. BUC is a white or slightly yellowish crystalline powder. It is practically insoluble in water, sparingly soluble in chloroform and Propan-1,2-diol and very slightly soluble in ethanol (96%) [1]. The melting point of BUC is 230-240ºC [2]. Analytical methods have been published for the analysis of BUC in tablet and human serum by LC and by spectrophotometry [3, 4]. Currently, high-performance thin-layer chromatography (HPTLC) is becoming a routine analytical technique owing to its low operating cost, high sample throughput, and need for minimum sample clean-up. High-performance thin-layer chromatography (HPTLC) has emerged as a key step toward improved separation efficiency, with smaller silica particles resulting in faster analysis, sharper peaks, improved resolution, and increased sensitivity Furthermore, connecting HPTLC with modern detectors such as Raman scattering and mass spectrometry has expanded the scope of HPTLC's utility [5]. The most important advantage of HPTLC is that several samples can be run simultaneously using a small quantity of mobile phase distinct from HPLC, thus lowering analysis time and cost per analysis [6, 7]. The objective of the present work is to establish a simple, precise, and accurate densitometric thin-layer chromatography (TLC) method for the analysis of BUC in bulk material and tablets. Further, the developed method has to be validated as per the International Conference on Harmonisation (ICH) guidelines [8, 9].
Materials and Methods
Chemicals and Reagents
A standard gift sample of Buclizine Hydrochloride was procured from R. L. Fine Chem. Bangalore, India and was used without further purification. Tablets of 25 mg strength were procured from a local pharmacy of a commercial brand. Water was bi-distilled. All other chemicals used were analytical or HPLC grade.
Instrumentation and Chromatography
A CAMAG HPTLC system (Muttens, Switzerland) comprising of CAMAG Linomate 5 automatic sample applicator, Hamilton syringe (100 μL), CAMAG TLC Scanner 3, CAMAG winCATS software, CAMAG twin trough chamber (20 cm × 10 cm), and ultrasonicator were used during the study. TLC plates used were precoated silica gel aluminium plates 60F254, (20 cm × 10 cm), with 250 μm thickness (E. Merck, Mumbai, India). The sample spots were scanned in reflectance mode at 230nm.
Chromatographic conditions
The plates were prewashed with methanol and activated at 110ºC for 5.00 min before chromatography. A constant application rate of 150 nL /s was used and the space between the two bands was 10 mm. The slit dimension was kept at 6 mm × 0.45 mm and the scanning speed was 20 mm/s. The monochromatic bandwidth was set at 20 nm. The mobile phase consisted of chloroform: ethyl acetate in the ratio of 8:2 v/v and 20.0 mL of mobile phase was used per chromatography run. Linear ascending development was carried out in a 20 cm × 10 cm twin trough glass chamber saturated with the mobile phase. The optimized chamber saturation time for the mobile phase was 20.00 min at room temperature (25.00ºC ± 2) at a relative humidity of 60.00 % ± 5. Each chromatogram was developed over a distance of 8 cm. Following the development, the TLC plates were dried in a stream of air with the help of an air dryer in a wooden chamber with adequate ventilation. Densitometric scanning was performed in the reflectance-absorbance mode at 230 nm. The source of radiation used was a deuterium lamp emitting a continuous UV spectrum between 400 to 190 nm. Concentrations of the compound chromatographed were determined from the intensity of the diffused light. The evaluation was performed by linear regression of peak areas determined by UV absorption as a function of sample amounts.
Preparation of Stock Standard and Sample Solution
A stock standard solution of 0.2 mg mL–1 of Buclizine Hydrochloride was prepared by dissolving 20 mg of it in 100 mL of methanol. To determine the content of Buclizine Hydrochloride in tablets, 20 tablets were weighed and powdered in a glass mortar. An amount of powder equivalent to 10 mg Buclizine Hydrochloride was transferred into a 100 mL volumetric flask, dissolved in methanol, and sonicated for 20 min; the solution was diluted to volume with the same solvent. The resulting solution was filtered through a 0.45-μm filter (Millifilter, Milford, MA, USA), then 2 mL of it was transferred into a 10 mL volumetric flask and volume made up to mark with methanol, and 5 μL equivalent to 200 ng Buclizine Hydrochloride was applied on a plate for assay of the drug sample. The stock solutions were stored at 6-8ºC protected from light.
Optimization of the HPTLC method
The HPTLC procedure was optimized to develop an assay method for BUC. The standard stock solution (100 μg / mL) was taken and a 1 μL sample was spotted on to HPTLC plate and run in different solvent systems. Initially, toluene, ammonia, ethyl acetate, and methanol were tried in different ratios. Finally, the mobile phase consisting of chloroform: ethyl acetate in the ratio 8:2 v/v was found optimum. To reduce the neckless effect TLC chamber was saturated for 20 min. The mobile phase was run up to a distance of 8 cm; which takes approximately 20 min for the complete development of the TLC plate (Table 1).
| Sr. No. | Parameters | Conditions |
|---|---|---|
| >1 | Stationary phase (column) | Precoated silica gel aluminum plate 60F254 (10 cm ×10 cm) with 250 μm thickness; (E.MERCK Darmstadt, Germany |
| 2 | Mobile Phase | Chloroform: Ethyl acetate (8:2 v/v) |
| 3 | Syringe | Camag 100 μl sample syringe(Hamilton,Bonaduz, Switzerland) |
| 4 | Sample Applicator | Camag Linomat 5 sample applicator (Switzerland) |
| 5 | Scanner | Camag TLC scanner 4 |
| 6 | Sample Volume (μL) | 2 |
| 7 | Detection wavelength(nm) | 230 |
| 8 | Software used | WINCATS software version 1.4.2 |
| 9 | Chemicals used | Merck Chemicals, Mumbai |
| 10 | Beer’s law limit (ng/ml) | 100 -600 |
| 11 | RF (min.) | 0.33 |
| 12 | Correlation coefficient(r2) | 0.999 |
Validation of the method
Validation was performed in terms of linearity, specificity, precision, limit of detection (LOD), limit of quantification (LOQ), and robustness, as per ICH guidelines (ICH, 1994, 1996).
● Linearity
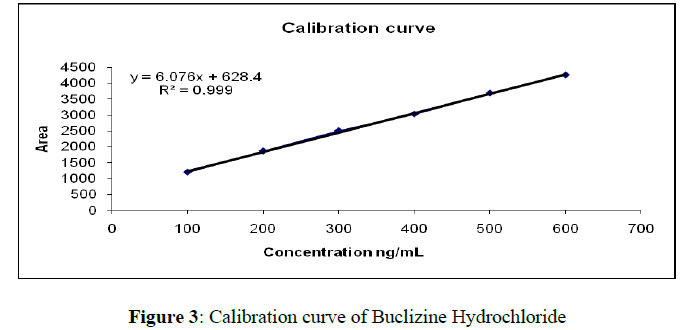
Working standard solutions containing different concentrations of the drugs (100- 600 ngμL–1 spot for BUC) were spotted in triplicate on an HPTLC plate. Linearity of the method was studied by applying six concentrations of the drug (each concentration was applied three times) on the HPTLC plates. The plate was then developed using the previously described mobile phase and the peak areas were plotted against the corresponding concentrations to obtain the calibration curves.
● Precision
The repeatability of the sample application and measurement of the peak area were measured using six replicates of the same band (400 ng BUC per band). Intra-day and inter-day precision for the analysis of BUC was measured at three different concentrations – 100, 400, and 600 ng per band. The precision of the method was verified by repeatability and intermediate precision studies. Repeatability studies were performed by analysis of three different concentrations (80, 160, and 240 ng/spot) of the drugs six times on the same day. The intermediate precision of the method was checked by repeating studies on three different days.
● Limits of Detection and Quantification
To estimate the limits of detection (LOD) and quantification (LOQ), blank methanol was applied six times following the method described above. The signal-to-noise ratio was determined. The LOD was regarded as the amount for which the signal-to-noise ratio was 3:1 and LOQ as the amount for which the signal-to-noise ratio was 10:1.
● Robustness of the method
Following the introduction of small changes in the mobile phase composition, the effects on the results were examined. Mobile phases having different compositions were tried and chromatograms were run. The amount of mobile phase varied over the range of ± 5 %. The time from spotting to chromatography and from chromatography to scanning varied from 10 min. The robustness of the method was determined at three different concentration levels 80, 160, and 240 ng/spot.
● Specificity
The specificity of the method was determined by analyzing the standard drug and test samples. The spot for BUC in the samples was confirmed by comparing the RF and spectrum of the spot with that of a standard. The peak purity of BUC was determined by comparing the spectrum at three different regions of the spot i.e. peak start (S), peak apex (M), and peak end (E).
● Accuracy
Accuracy of the method was carried out by applying the method to drug sample (tablet formulation) to which know the amount of BUC standard powder corresponding to 80, 100 and 120 % of label claim were over-spotted (standard addition method), and analyzed triplicate.
● Stability in Sample Solution and Band Stability
Solutions of analytical concentration (1000 μg mL–1) were prepared from the sample solution and stored for 12, 24, 48, and 72 hours at room temperature, on a laboratory bench, in tightly capped volumetric flasks protected from light. They were then applied on the TLC plate and analyzed by the developed method, for the presence of any additional band other than the drug peak.
● Analysis of a marketed formulation
To determine the content of BUC in conventional tablet, the Label claim: 25 mg/tablet, twenty tablets were weighed, their mean weight determined, and finely powdered. The weight of the tablet triturate equivalent to 25 mg of BUC was transferred into a 25 mL volumetric flask containing 25 mL methanol, sonicated for 30 min. The resulting solution was centrifuged at 3000 rpm for 5 min and the drug content of the supernatant was determined (100 μgmL–1). Then 2 μL of this solution (200 ng/spot) was applied to a TLC plate which was developed in the optimized mobile phase. The analysis was repeated in triplicate. The possibility of excipients interference with the analysis was examined.
RESULTS AND DISCUSSION
Linearity
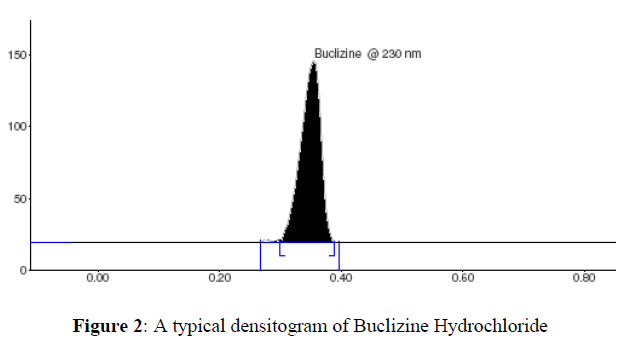
The linear regression data for the calibration plots (n = 6), shown in Table 2, are indicative of a good linear relationship between peak area response and concentration over the range of 100–600 ng per band (Figure 2). The equation for the calibration plot is y = (3.5800 ± 0.0496) x + (468.67 ± 29.86) (n = 6, at 230 nm). The linearity of the calibration plots and adherence of the system to Beer’s law was validated by the high value of the correlation coefficient (r ± SD = 0.9946 ± 0.0013). No significant differences were observed between slopes of standard plots (Figure 3).
Precision
| Sr. No. | Concentration(ng/mL) | Area |
|---|---|---|
| >1 | 100 | 920.6 |
| 2 | 200 | 1863.7 |
| 3 | 300 | 2502 |
| 4 | 400 | 3028.1 |
| 5 | 500 | 3584.8 |
| 6 | 600 | 4255 |
The repeatability of the sample application and measurement of peak area is expressed as RSD. Results from the measurement of intra-day and inter-day variation at a concentration of 200 ng per band are listed in (Table 3) RSD for within-day and day-to-day analysis was found to be less than 2%. These low RSD values are indicative of good repeatability and precision of the method (Figure 4).
| Concentration (ng/spot) |
Repeatability (n=6) | Intermediate precision (n=6) | ||||
|---|---|---|---|---|---|---|
| >Measured conc. |
RSD (%) |
Recovery (%) |
Measured conc. | RSD (%) |
Recovery (%) |
|
| 200 | 198 | 0.32 | 99.98 | 198 | 0.41 | 99.97 |
Robustness
The standard deviation of peak areas was calculated for each condition and RSD was less than 2%. The low values of RSD listed in Table 4 are indicative of the robustness of the method.
| Parameter | Normal condition | Modified condition | S.D | R.S.D. (%) |
|---|---|---|---|---|
| >Mobile phase composition chloroform: ethyl acetate | 8:2 v/v | 8.2:1.8 v/v | 0.86 | 0.48 |
| Amount of mobile phase | 20 ml | 22 ml | 0.57 | 0.27 |
| Temperature | R.T. | 40 0C | 0.75 | 0.47 |
| Plate saturation time | 20 min | 22 min | 0.44 | 0.30 |
Limits of Detection and Quantification
The detection limit and quantitation limit for signal-to-noise ratios of 3:1 and 10:1 were 25 and 150 ng per band, respectively, which indicates the sensitivity of the method is adequate.
Specificity
Peak purity for BUC was assessed by comparing chromatogram acquired at the peak start, apex, and end positions of the band, r2(S, M) = 0.9999 and r2(M, E) = 0.999. A Good correlation (r2 = 0.999) was also obtained between the standard and sample chromatogram of BUC. These correlation values indicate the ability of the method to separate and specifically detect BUC from sample solutions.
Recovery
When the method was used for extraction and subsequent analysis of BUC in tablet dosage forms after spiking with 80, 100, or 120% excess drug the recovery was 98.97–99.86 %, as listed in Table 5.
| Label claim (mg/tablet) |
Amount added | Total amount (mg) | Amount Recovered (mg) ± % RSD |
Recovery (%) |
|
|---|---|---|---|---|---|
| (mg) | % | ||||
| >25 | 20 | 80 | 45 | 0.67 | 99.86 |
| 25 | 25 | 100 | 50 | 0.71 | 99.47 |
| 25 | 30 | 120 | 55 | 0.93 | 98.97 |
Stability in Sample Solution
The analyte was stable in solution because no significant deviation in peak area (RSD < 2%) was observed on analysis up to 72 hours. There was no indication of drug instability in the sample solution.
Analysis of a formulation
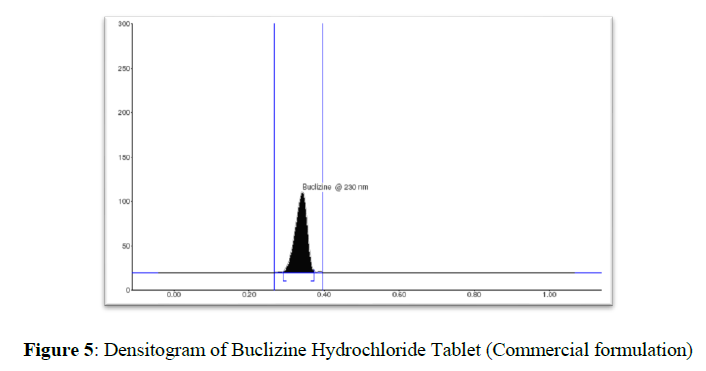
Experimental results of the amount of BUC in tablets, expressed as a percentage of label claims were in good agreement with the label claims thereby suggesting that there is no interference from any of the excipients which are present in tablets. Drug bands at RF 0.33 corresponding to BUC were observed in chromatograms obtained from tablet extracts (Figure 5). The BUC content of marketed tablets was 99.57, RSD 0.21%, respectively (Table 6). The good performance of the method indicated the suitability of this method for routine analysis of BUC in the pharmaceutical dosage form.
| Buclizine hydrochloride | Buclizine hydrochloride found (mg/tablet) | |
|---|---|---|
| Mean ± SD (n= 6) | Recovery (%) | |
| >25 mg | 24.79 ± 0.99 | 99.57 |
DISCUSSION
The observation and outcome obtained from each validation experiment including specificity, linearity and range, LOD and LOQ, precision, accuracy, robustness, solution stability, and system suitability lie well inside the acceptance criteria. Ever since all the results are within the limit, the developed analytical method is considered validated and suitable for anticipated use.
CONCLUSION
The developed HPTLC method is precise, specific, and accurate for the analysis of Buclizine Hydrochloride (BUC) API and in the pharmaceutical formulation without any interference from the excipients. The developed method is rapid, simple, and cost-effective for the quality control of Buclizine Hydrochloride (BUC) with mobile phase chloroform: ethyl acetate in the ratio 8: 2 v/v. The used methodology was sensitive, specific, reliable, and reproducible for the analysis of BUC.
Declaration of competing interest
The authors declare that they have no conflict of interest.
Acknowledgment
The authors would like to thank Sinhgad Technical Education Society, Sinhgad Institute of Pharmacy, Narhe, Pune, for providing the necessary infrastructural facilities to perform this study.
References
- Martindale. The Extra Pharmacopeia, Royal Pharmaceuticals Society of Great Britain. 1996, p. 435-436.
- Mostafa GAE, Al-Badr AA. Elsevier Inc. 2011, 36: p. 1-33.
- Kuminek G. Quim Nova. 2012, 35(1): p. 207-212.
- Arayne MS. Pak J Pharma Sci. 2006, 19(4): p.326-329.
- Abou Al-Alamein AM, Abd El-Rahman MK, Abdel-Moety EM, et al., Microchem J. 2019, 147: p. 1097-1102.
- Kishore M. Int J Curr Pharm Res. 2010, 2(4): p. 48-51.
- Arayne MS. J Chromatogr Sci. 2010, 48: p. 382-385.
- ICH, Q2B, Validation of analytical procedure: methodology. In: Proceedings of the International Conference on Harmonization, Geneva.1996.
- ICH guideline, Q2 (R1) step 4, Validation of Analytical Procedures: Text and Methodology, 2005.
Indexed at, Google Scholar, Crossref


