Research Article - Der Pharma Chemica ( 2018) Volume 10, Issue 9
Electrochemical Behaviour of Manganese(Ii)-Dithiocarbamate Complexes: Analysis of Manganese(Ii) in Real Samples
Niranjan T1*, Giridhar C2, Redhi G1 and Venkatasubba Naidu N2
1Department of Chemistry, Durban University of Technology, P.O. Box 1334, Durban 4000, South Africa
2Department of Chemistry, Sri Venkateswara University, Tirupati-517502, Andhra Pradesh, India
- *Corresponding Author:
- Niranjan T
Department of Chemistry
Durban University of Technology
P.O. Box 1334, Durban 4000, South Africa
Abstract
A simple, low cost and highly sensitive catalytic hydrogen signals (CHSs) technique has established for the investigation of Manganese(II) by means of ammonium 4-phenylpiperazine-1-dithiocarbamate and ammonium 4-benzylpiperidine-1-dithiocarbamate in various ecofriendly and biological matrices using D.C. polarography. This procedure was initiated on the reaction of Manganese(II) in APP-DTC/ABP-DTC in the existence of NH4Cl-NH4OH medium at pH 6.6 and 7.2 respectively. The resulting oxidation signals were obtained at -0.78 V and -0.64 V vs SCE, owing to the CHSs. Different experimental conditions such as pH effects, background electrolyte (NH4Cl-NH4OH) effects and DTCs and Manganese(II) ion effects have been studied. The current procedure was effectively applied for the testing of Manganese(II) in sundry environmental and biological samples and attained recovery percentages (95-99%) are comparable to the Atomic Absorption Spectrophotometry (AAS) method.
Keywords
D.C. polarography, Atomic absorption spectrophotometry, Manganese(II), Catalytic hydrogen signals (CHSs), APP-DTC, ABP-DTC.
Introduction
Manganese is a trace element, which plays a significant role in metabolism of humans, animals and plants. Manganese is normally found throughout most aquatic environments. Manganese has different oxidation states, divalent state is the utmost stable and significant one, manganese(II) which produce a sequence of bonds with many chelating agents. Mn is mainly exploited in the manufacture of steel and rechargeable batteries in industries. In the chemical industry it is used as oxidizing agent.
Manganese is obtained from plants and also in animal tissues [1] and found in all foods and drinking water. The highest percentage of Mn found in nuts and whole cereals [2], varying quantities in vegetables, and slight concentration in meat, fish and dairy products. Manganese is extraordinarily rich in tea [2,3]. In adults, norm intake of Mn in a day is 2.2-2.7 mg, the average Mn(II) in human blood is 24 ± 8 mg [4]. 6.1 ppm Mn in the fleece of sheep feed a small amount of Mn diet for 154 days [5], and produced 18.7 ppm in the fleece of controlled sheep. Pullets feed a fine diet covering 81 ppm Mn produced eggs contains 28.6 ± 0.78 μg Mn [6]. Deficiency of vitamin K in man is due to lack of Mn. In human blood, haemoglobin percentage do not appears to be influenced by lack of Mn [7,8].
In mammals and birds, Mn is the lowest toxic of trace elements. The adversative effects of surplus Mn on development were shown to be mostly a reflection of decrement appetite. The relation between manganese, iron and haemoglobin genesis has demonstrated in sheep’s, pigs and rabbits [9,10]. Continuous working in Mn ores, results chronic Mn poisoning arise in mineworkers. From these pollutant environment surplus manganese pass in to the human body as oxide dust through lungs and gastro intestinal [11]. Mn poisoning leads to an acute psychiatric ailment like schizophrenia, subsequent lasting cripple neurological ailment clinically like Parkinson’s disease.
The catalytic currents due to manganese complexation with various reagents have been reported in the literature. Bis (hydroxyl methyl) dithiocarbamate and dimethyl dithiocarbamate in acetate buffer in presence of Mn(II) and Fe(II) in aqueous ethanol, aqueous DMF media were found to give catalytic hydrogen waves [12]. Catalytic and kinetic signals of Mn are utilized in the analysis of Mn in alloys. Xanthates and antipyrine forming complexes with Mn which produces catalytic signals at DME, thus allows trace level of manganese at ppm without much interference from other metal ions using simple D.C. polarograph. This technique is applied to estimate Mn(II) in soil, agricultural, and environmental matrices [13-15].
From the literature survey it is seen that dithiocarbamates have not been used as an electro-analytical complexing reagent. The polarographic studies of manganese(II) in the existence of APP-DTC and ABP-DTC in NH4Cl-NH4OH medium indicated that a catalytic hydrogen signals (-0.3 V to -0.9 Vs SCE) were obtained with a peak at -0.78/-0.64 V Vs SCE for APP-DTC/BP-DTC. The typical polarographic current-voltage curves are given in Figure 1. The E1/2 of Mn(II) in NH4Cl medium is at about -0.8 V vs SCE, negative to catalytic current. To develop quantitative experimental conditions for selective and subtle technique for the estimation of Mn(II), the effect of various analytical parameters ware studied on manganese(II)–dithiocarbamate system and the results obtained are summarized.
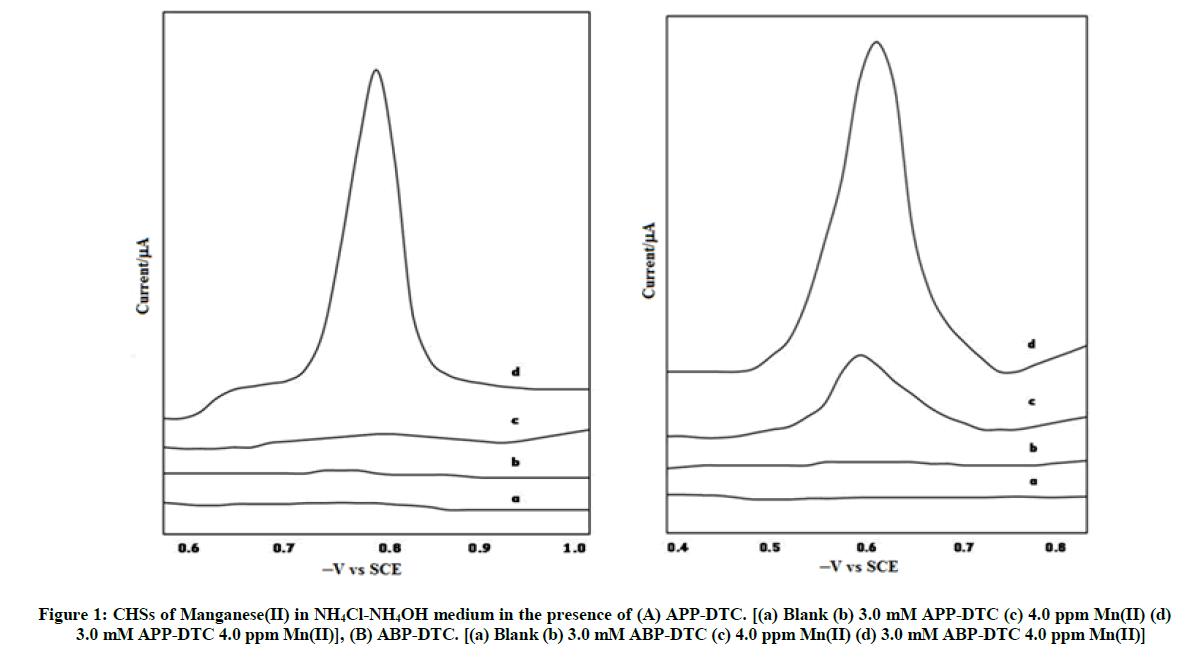
Figure 1: CHSs of Manganese(II) in NH4Cl-NH4OH medium in the presence of (A) APP-DTC. [(a) Blank (b) 3.0 mM APP-DTC (c) 4.0 ppm Mn(II) (d) 3.0 mM APP-DTC 4.0 ppm Mn(II)], (B) ABP-DTC. [(a) Blank (b) 3.0 mM ABP-DTC (c) 4.0 ppm Mn(II) (d) 3.0 mM ABP-DTC 4.0 ppm Mn(II)]
Materials and Methods
Chemicals
All the chemicals were reagent mark or higher and were utilized as received unless otherwise specified. NH3, CS2, NH4Cl, 1-phenylpiperazine and 4-benzylpiperidine were brought from Sigma-Aldrich, India. Preparation of standard solution of manganese(II) (1 μg ml-1) by taking 3.928 gl-1 of CuSo4.2H2O and liquified in millipore water and transferred in one litre volumetric flask. Preparation of APP-DTC/ABP-DTC (0.01 M) whilst by taking 2.55/2.67 g of APP-DTC/ABP-DTC and then dispersed it in 100 ml millipore water. Preparation of stock solutions of DTCs and NH4Cl-NH4OH by proper dilutions in 250 ml standard flasks, then stored at 4ºC.
Reagents
A 5% NH4OH and 1% HCl (Sigma-Aldrich, India) utilized for pH modifications were made from Analytical R chemicals. KIO3 and Na2SO3 (Sigma-Aldrich, India) were likewise prepared in millipore water via reagent mark samples. Preparation of Triton X-100 in w/v basis by taking 0.2 g and dissolved it to 100 ml with millipore water. Preparation of Gelatin (Difco laboratories, USA) by taking 0.1250 g and dispersed to 25 ml in millipore water.
Instrumentation
Direct current polarography, model CL-357 and CL-25 were used in this study (Elico Private Ltd, Hyderabad, India). The AA 6300 Shimadzu spectrometer furnished with a deuterium background corrector and hollow cathode lamp, at corresponding wavelengths (resonance line) with an air acetylene flame. The experimental parameters were those suggested by the manufacturer.
Synthesis of APP-DTC and ABP-DTC
40 g of CS2 was steadily mixed with 45 g of 1-phenylpiperazine/4-benzylpiperidine in 25 ml of millipore water at 5ºC with continuous rousing, and then adding NH4OH which was diluted in 20 ml of millipore water. The final compound was brought to normal temperature and washed with acetone (Scheme 1) [16-24].
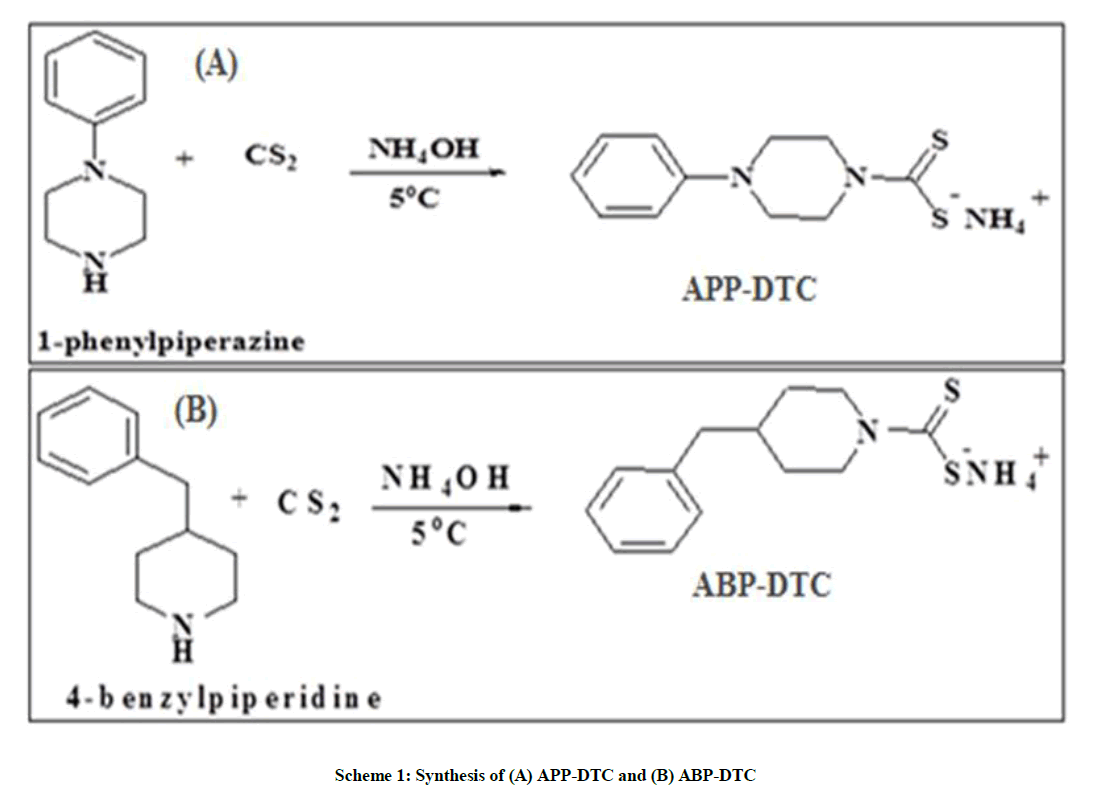
Scheme 1: Synthesis of (A) APP-DTC and (B) ABP-DTC
Electrochemical measurements
Measured volumes of NH4Cl-NH4OH, APP-DTC and ABP-DTC and then metal solutions were transferred into the 100 ml beaker. The pH was adjusted by means of 0.1 M HCl or NaOH and poured into the polarographic cell. Subsequently, the solution was purged with pure nitrogen gas (99.9 %) for 15 min to removal of oxygen dissolved in the solution. Lastly, the polarograms were recorded using the D.C. Polarography techniques were illustrated in Figure 1.
Results and Discussion
Optimization of analytical parameters
In this section, various experimental conditions were optimized for the detection of manganese(II) at DME.
pH effect
The pH effect on mixtures holding 4.0 ppm of manganese(II) in 0.4/0.5 M NH4Cl were studied, by means of 3.0 mm of APP-DTC/ABP-DTC as bonding agents, altering the pH from 5.0 to 10.0 with NH4OH. With rising pH, the height of the signals reached to maximum at pH 6.6/7.2 (APP-DTC/ABP-DTC) then decrement in peak height. The optimum height of the polarograms was continued for more studies. The results were given in Figure 2.
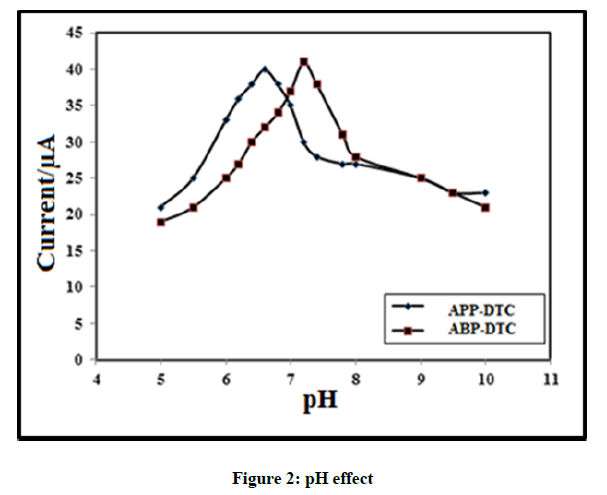
Figure 2: pH effect
Effect of electrolyte concentration
The effect of NH4Cl between 0.1 to 0.6 M on the nature of CHSs at DME, maintaining the concentrations of Mn(II) at 4.0 ppm and DTC at 3.0 mm (APP-DTC/ABP-DTC) and adjusting the pH to 6.6/7.2 (APP-DTC/ABP-DTC). The polarogram were well-described in NH4Cl of 0.4/0.5 M for APP-DTC/ABP-DTC. The height of the peak decrement after this concentration and hence, 0.4/0.5 M (APP-DTC/ABP-DTC) was kept for more analysis and the results are tabulated in Figure 3. The potential of the catalytic signal moved significantly towards negative potentials with increase in supporting electrolyte concentrations.
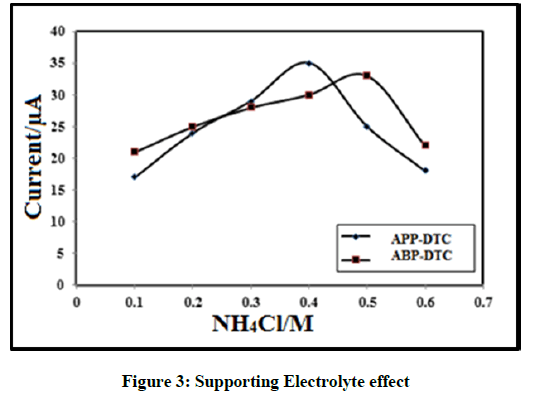
Figure 3: Supporting Electrolyte effect
Effect of reagent concentration
Sequence of solutions holding 4.0 ppm of Manganese(II), 0.4 M and 0.5 M NH4CL for APP-DTC/ABP-DTC respectively with 2.0 to 7.0 mm DTCs (APP-DTC and ABP-DTC) were polarographed, keeping the pH at 6.6/7.2 in APP-DTC/ABP-DTC respectively. The signals are not linear with all concentrations of DTC, which menace wave is catalytic in nature, and the obtained values were presented in Figure 4. From the obtained values, wave height was independent of concentration above 4.8 mm representing that the complex is stable. Hence the maximum concentration of DTCs 4.8 mm fixed for further studies. On increasing the DTC concentration, the peak potential of catalytic wave moved towards negative potential to higher concentration reported earlier and continued to be constant after these concentrations. Plot of reagent concentration is straight line (Figure 5) conforming that adsorption phenomenon was convoluted in the electrode reaction procedure.
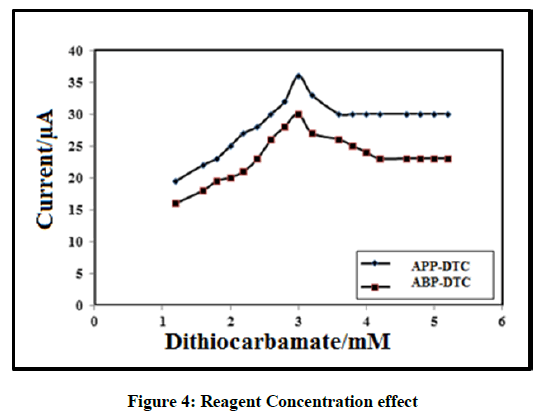
Figure 4: Reagent Concentration effect
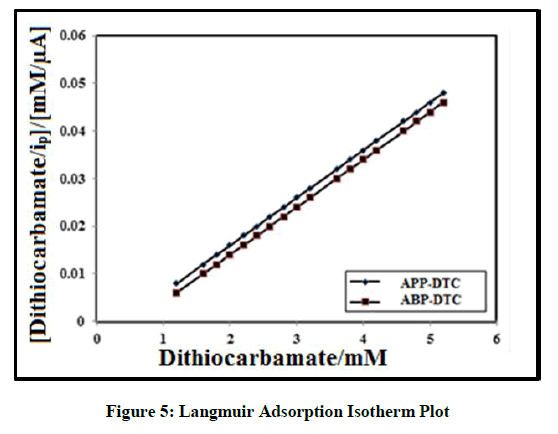
Figure 5: Langmuir Adsorption Isotherm Plot
Effect of mercury pressure
The effect of pressure of mercury in the reservoir on the peak height was examined at various mercury column heights. As the column height (h) of the mercury reservoir is increased peak height and ic/√h hare slightly decreased where iC is the average catalytic current. The reduced peak height with the rise in mercury reservoir is characteristic of CHSs as illustrated in Table 1.
| S. No. | Mercury column height/cm | APP-DTC | ABP-DTC | ||
|---|---|---|---|---|---|
| Current/μA | ic / √h / μA | Current/μA | ic / √h / μA | ||
| 1 | 23 | 37.25 | 1030 | 36.5 | 1017 |
| 2 | 28 | 36.75 | 985 | 34.75 | 972 |
| 3 | 33 | 35 | 876 | 32.05 | 937 |
| 4 | 38 | 35.75 | 827 | 31.4 | 892 |
Table 1: Effect of mercury pressure
Maximum suppressors effect
The gelatine and Triton X-100 effects ranging from 0.005 to 0.01% and 0.002 to 0.004% was performed on the nature analyte signal in NH4Cl- NH4OH buffer in the presence of DTC. The peak height was condensed (20%) by addition of 0.005% gelatine with marginal decrement in peak height. Though, upsurge in the gelatine concentration, the peak potential moves towards less negative. By adding 0.002% Triton X-100 the CHSs was decrement by 10%. Beyond 0.002% of Triton X-100, the CHSs decrement marginally in both cases, signifying the catalytic nature of the signals as illustrated in Table 2.
| S. No. | Maximum suppressor, % | Current/μA | |
|---|---|---|---|
| APP-DTC | ABP-DTC | ||
| Gelatin | |||
| 1 | 0 | 37.75 | 36.55 |
| 2 | 0.005 | 26.05 | 25.9 |
| 3 | 0.01 | 24.65 | 25.35 |
| Triton X-100 | |||
| 1 | 0 | 37.55 | 36.15 |
| 2 | 0.002 | 26.4 | 25.75 |
| 3 | 0.004 | 25.35 | 24.95 |
Table 2: Effect of maximum suppressors
Temperature effect
The temperature effect on the DTCs were studied at various temperatures, i.e., 15 to 45oC and observed that as the temperature increase, the peak height increased and temperature coefficient values decremented slowly. Therefore current, ic converted totally temperature independent above 30°C.
Manganese(II) concentration effect
On fixed concentration of DTC, (3.0 mm, APP-DTC/ABP-DTC) and (0.4/0.5 M for APP-DTC/ ABP-DTC) NH4Cl varying the pH to 6.6/7.2, Concentration of the metal ion was adjusted among 0.05 to 6.0 ppm and its results of CHSs were studied. The peak current increased linearly with Mn(II) concentration in the range 0.05 to 4.0 ppm in case of two DTCs. Nevertheless, the susceptive of the technique was more with APP-DTC and ABP-DTC since the solid complex of manganese(II) and increased catalytic activity. The results are given in Figure 6. This technique suggests that the analysis of micro-amount of manganese(II) is probable in unknown samples.
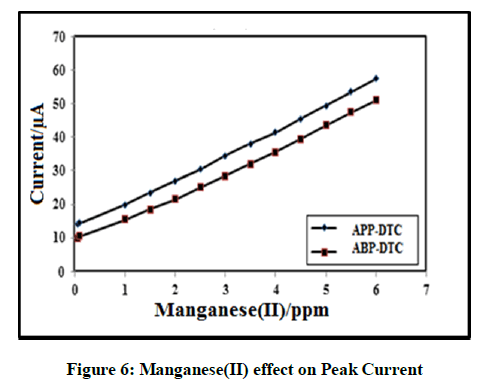
Figure 6: Manganese(II) effect on Peak Current
Effect of foreign ions
Different metal ions effect on manganese(II) was carried out based on the CHSs. The CHSs of the mixture comprising 4.0 ppm Cr(VI), in 0.4/0.5 M NH4Cl at pH 6.6/7.2 for two ligands (3.0 mm APP-DTC/ABP-DTC) as bonding agents. Metal ions such as Fe2+, Co2+, Ni2+, Mn2+, Cu2+, V5+ in 100 fold excess were recorded. Interestingly, it was observed that Co2+ oxidized to Co3+ by atmospheric oxygen was separated by bubbling of N2 gas and triggered with DTCs. The resulted solid was removed and filtrate was polarographed after nitrogen gas bubbling. On the other hand, V5+ slightly interfered then disguised by addition of 2 ml 1% sodium fluoride solution. Similarly, Ni2+ also precipitate in the pH range of Mn(II)- DTC systems.
The excipient effect with other metals namely, Cd2+, Hg2+, Pb2+, Al3+, Ag+, U6+, Se4+, Te+4, Ce4+, Sn4+ and Mo6+ was studied. Among these metal ions, only Mo6+ enormously interfered as the CHSs of Mo6+ was attained even in the nonappearance of DTC. The remarks were alike for two ligands. The other ions such as bromide, fluoride, tartrate, iodide, phosphate, thiosulphate, citrate, perchlorate and sulphate do not impede with the CHSs of Mn(II)- DTC system. Though, carbonate and EDTA affect gravely by suppressing the CHSs of Mn(II) as per they give rise to strong bonds with the metal ion. Nitrite and nitrate give CHSs with Mn(II) without DTCs also.
Effect of indifferent cations
The indifferent cations effect was verified at fixed pH, ligand and Mn(II) and NH4Cl-NH4OH concentrations. In this study, sodium, alkali chlorides, lithium and calcium were used. The existence of these ions reduces the CHSs as shown in Figures 7 and 8. Obtained results suggested that the calcium has stronger suppressing effect on the CHSs compared to other ions. The CHSs drops constantly with increase in chloride ions concentration. The sodium chloride effect was lower than potassium chloride, with lithium chloride and calcium chloride peak height decrease highly. In all cases, with increase in chloride concentration potential of the CHSs moved to negative potentials. The decrease in CHSs due to indifferent ions suggested the adsorption properties of chromium(VI)-CDT complexes on the electrode surface.
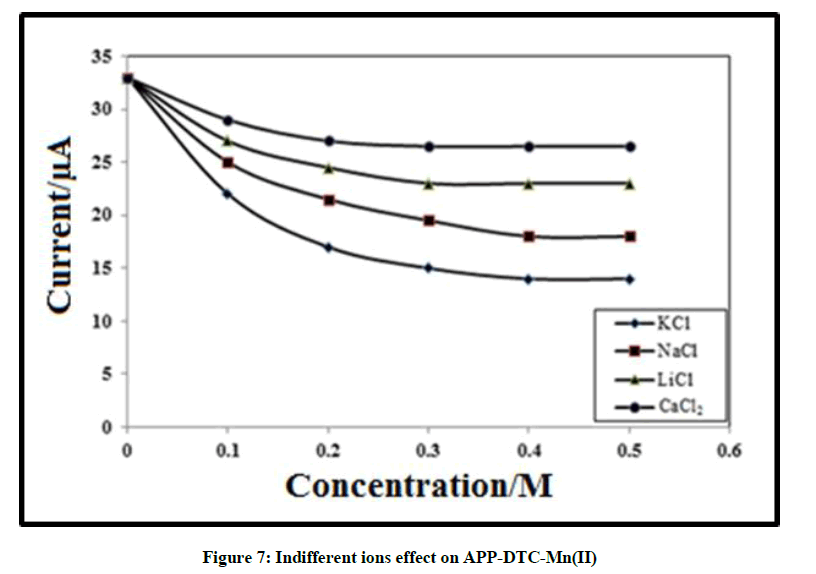
Figure 7: Indifferent ions effect on APP-DTC-Mn(II)
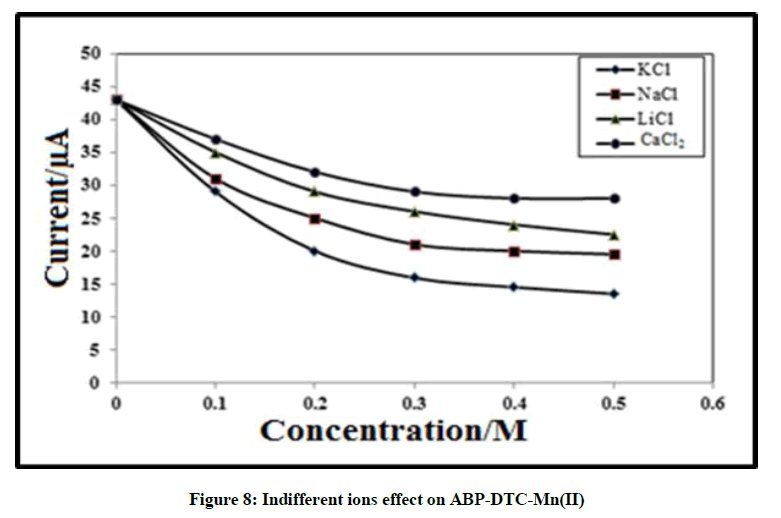
Figure 8: Indifferent ions effect on ABP-DTC-Mn(II)
Real samples analysis
The CHSs method developed is applied for the estimation of traces of manganese(II) in various water samples and vegetable samples.
Water samples
One liter of the water samples collected from Industrial Estate and Amararaja batteries (Tirupati town, Chittoor Dt.) are preconcentrated and analysed. The results attained by this technique are additionally supported by Atomic Absorption spectrophotometer technique. The analytical data illustrated in Tables 3 and 4 suggests that the recovery percentage of Mn(II) from drinking water, leafy vegetable, medicinal plant and Biological samples ranging from 95.00 to 100.00% which is highly reliable and sensitive.
| Samplea | Mn(II) added/ppm | CHSs method (DC Polarography) | AAS method | ||
|---|---|---|---|---|---|
| APP-DTC | APP-DTC | ||||
| Mn (II) found/ppm | Recovery (%) ± R.S.Db | Mn(II) found/ppm | Recovery (%) ± R.S.Db | ||
| I | 0.2 | 0.324 | 98.95 ± 2.35 | 0.285 | 99.54 ± 2.49 |
| 0.4 | 0.504 | 99.64 ± 2.46 | 0.473 | 97.96 ± 2.64 | |
| 0.6 | 0.716 | 98.75 ± 2.48 | 0.764 | 98.50 ± 2.60 | |
| 0.8 | 0.876 | 98.40 ± 2.39 | 0.892 | 98.90 ± 2.38 | |
| 1 | 1.152 | 101.04 ± 2.57 | 1.137 | 99.36 ± 2.86 | |
| II | 0.2 | 0.296 | 97.92 ± 2.62 | 0.283 | 101.05 ± 2.69 |
| 0.4 | 0.473 | 98.39 ± 2.85 | 0.406 | 98.26 ± 2.62 | |
| 0.6 | 0.695 | 99.61 ± 2.54 | 0.706 | 99.04 ± 2.33 | |
| 0.8 | 0.92 | 99.82 ± 2.67 | 0.913 | 99.55 ± 2.65 | |
| 1 | 1.182 | 98.45 ± 2.63 | 1.207 | 101.45 ± 2.75 | |
I Industrial Estate; II Amara raja Batteries; aFive millilitres of the concentrated sample is used, bRelative standard deviation (n=6)
Table 3: Analysis of Manganese(II) with APP-DTC in Drinking Water Samples around Tirupati, Chittoor District, A.P. India
| Samplea | Mn(II) added/ppm | CHSs method (DC Polarography) | AAS | ||
|---|---|---|---|---|---|
| ABP-DTC | ABP-DTC | ||||
| Mn(II) found/ ppm | Recovery (%) ± R.S.Db | Mn(II) found/ ppm | Recovery (%) ± R.S.Db | ||
| I | 0.2 | 0.307 | 99.65 ± 2.35 | 0.301 | 98.36 ± 2.42 |
| 0.4 | 0.493 | 98.20 ± 2.57 | 0.52 | 99.06 ± 1.98 | |
| 0.6 | 0.674 | 98.5 ± 2.25 | 0.719 | 99.24 ± 2.24 | |
| 0.8 | 0.879 | 99.30 ± 2.62 | 0.865 | 100.16 ± 1.46 | |
| 1 | 1.082 | 99.75 ± 2.96 | 1.164 | 98.36 ± 2.28 | |
| II | 0.2 | 0.269 | 99.50 ± 2.50 | 0.278 | 99.75 ± 2.38 |
| 0.4 | 0.471 | 97.55 ± 2.34 | 0.521 | 98.84 ± 1.86 | |
| 0.6 | 0.708 | 98.35 ± 2.56 | 0.673 | 98.95 ± 2.04 | |
| 0.8 | 0.923 | 99.74 ± 2.28 | 0.892 | 100.64 ± 1.76 | |
| 1 | 1.119 | 100.00 ± 2.48 | 1.136 | 99.16 ± 1.97 | |
I Industrial Estate; II Amara raja Batteries; aFive millilitres of the concentrated sample is used, bRelative standard deviation (n=6)
Table 4: Analysis of Manganese(II) with ABP-DTC in Drinking Water Samples around Tirupati, Chittoor District, A.P. India
Leafy vegetable samples and medicinal plant (leaves)
A measured quantity (3.5 g) of vegetable and medicinal plant (leaves) samples were brought from the market then processed via dry ash procedure and then it is made up to 100 ml with double distilled water. Aliquots of the above solutions were taken and polarographed using developed conditions. The results attained by this technique were illustrated in Tables 5 and 6.
| Samplea | Mn(II) Added/ ppm | CHSs method (DC Polarography) | AAS | ||
|---|---|---|---|---|---|
| APP-DTC | APP-DTC | ||||
| Mn(II) found/ppm | Recovery (%) ± R.S.Db |
Mn(II) found/ ppm | Recovery (%) ± R.S.Db |
||
| Leafy Vegetables | |||||
| Ammaranthyus graecizans/ Sirraku | 3 | 3.24 | 98.86 ± 2.38 | 3.16 | 97.93 ± 2.82 |
| Ammaranthus cruentus/ Thottakura | 3 | 3.18 | 97.92 ± 2.64 | 3.31 | 99.54 ± 2.16 |
| Medicinal Plants | |||||
| Calotropis gigantean/ Thella gilleddu | 3 | 3.08 | 97.65 ± 2.38 | 3.19 | 98.64 ± 2.62 |
| Cassia auriculate/ Thangeddu | 3 | 3.22 | 100.12 ± 1.72 | 3.37 | 100.00 ± 1.94 |
aFive millilitres of the concentrated sample is used, bRelative standard deviation (n=6)
Table 5: Analysis of Manganese(II) with APP-DTC in Leafy Vegetables and Medicinal Plant samples around Tirupati, Chittoor District, A.P. India
| Samplea | Mn (II) added/ ppm | CHSs method (DC Polarography) | AAS method | ||
|---|---|---|---|---|---|
| ABP-DTC | ABP-DTC | ||||
| Mn(II) found/ppm | Recovery (%) ± R.S.Db |
Mn(II) found/ppm | Recovery (%) ± R.S.Db |
||
| Leafy Vegetables | |||||
| Ammaranthyus graecizans/ Sirraku | 3 | 3.14 | 97.35 ± 2.56 | 3.09 | 97.48 ± 2.62 |
| Ammaranthus cruentus/ Thottakura | 3 | 3.35 | 100.02 ± 1.86 | 3.16 | 99.16 ± 1.97 |
| Medicinal Plants | |||||
| Calotropis gigantean/ Thella gilleddu | 3 | 3.28 | 99.76 ± 2.14 | 3.21 | 100.03 ± 1.25 |
| Cassia auriculate/ Thangeddu | 3 | 3.19 | 98.95 ± 2.58 | 3.14 | 98.62 ± 2.34 |
aFive millilitres of the concentrated sample is used, bRelative standard deviation (n=6)
Table 6: Analysis of Manganese(II) with ABP-DTC in Leafy Vegetables and Medicinal Plant samples around Tirupati, Chittoor District, A.P. India
Milk samples
In a crucible, samples of milk were dropped slowly and heated for one hour at 450ºC-500ºC, without frothing moisture was vaporised. The ash collected was dissolved in 3 ml conc. HNO3 and evaporated, and again liquified in the 3 ml of dilute HNO3. The obtained samples were filtered and diluted to 25 ml in a flask for future experiments. These samples were used to investigate chromium(VI) and results are presented in Table 7.
| Cow Milk | Mn(II) added/ppm | Mn(II) Found in samples, ppm | |||
|---|---|---|---|---|---|
| CHSs method (DC Polarography) | AAS Method | ||||
| APP-DTC | ABP-DTC | APP-DTC | ABP-DTC | ||
| 1 | 1 | 1.60 ± 1.611 | 1.62 ± 1.517 | 1.64 ± 2.486 | 1.67 ± 1.732 |
| 2 | 1 | 1.75 ± 2.627 | 1.73 ± 1.429 | 1.74 ± 1.974 | 1.79 ± 2.429 |
| 3 | 1 | 1.56 ± 1.973 | 1.53 ± 1.522 | 1.52 ± 1.496 | 1.57 ± 1.499 |
| 4 | 1 | 1.66 ± 1.483 | 1.62 ± 1.426 | 1.64 ± 1.774 | 1.68 ± 1.515 |
| 5 | 1 | 1.54 ± 1.592 | 1.55 ± 0.615 | 1.57 ± 1.599 | 1.60 ± 2.432 |
| 6 | 1 | 1.36 ± 1.985 | 0.38 ± 1.337 | 1.39 ± 1.502 | 1.42 ± 2.448 |
| 7 | 1 | 1.62 ± 1.496 | 1.61 ± 1.545 | 1.64 ± 1.610 | 1.66 ± 1.763 |
| 8 | 1 | 1.51 ± 1.626 | 1.50 ± 1.419 | 1.54 ± 2.429 | 1.57 ± 1.732 |
| 9 | 1 | 1.71 ± 1.486 | 1.73 ± 1.428 | 1.75 ± 1.490 | 1.75 ± 1.748 |
| 10 | 1 | 1.76 ± 1.484 | 1.74 ± 1.402 | 1.77 ± 1.531 | 1.81 ± 2.447 |
1 ml of the sample is used, RSD for 5 individual determination
Table 7: Analysis of Manganese(II) with APP-DTC/ABP-DTC in Cow Milk
Conclusion
The polarographic reduction of manganese(II) in aqueous solution in the presence of dithiocarbamate shows a catalytic signal as a function of concentration of supporting electrolyte, pH and metal ion. These effects are studied to establish the catalytic character of the complex. The graph of the catalytic current as a function of the concentration of dithiocarbamate shows that the signal does not vary linearly with the concentration of dithiocarbamate which is the characteristic of Brdicka CHSs. It is assumed that the dithiocarbamate complexes with metal ions involve adsorption process and can be described by a Langmuir adsorption isotherm and the plot of CL/ip Vs CL should be linear. Such a plot is found with manganese complexes of dithiocarbamates studied as shown in Figure 6. With increase in mercury reservoir height and decrease of current catalytic signals suggests that the signals is kinetically controlled [25].
Effect of ionic strength of independent cations explains the adsorption process. The presence of an independent electrolyte reduces the signal height (Figures 7 and 8) and this effect is correlated with the adsorption and catalytic nature of manganese-dithiocarbamate complexes on mercury which is characteristic of catalytic surface reactions.
It is known that the surface catalytic signals are virtually independent of temperature, and these currents increase at high temperatures which is a deviation from purely kinetic behaviour. This is because an increase of the rate constant of protonation of the catalyst is compensated by reduction in its adsorptivity on the electrode surface.
References
- C. Reilly, John Wiley & Sons., 2008.
- H.A. Schroeder, J.J. Balassa, I. H. Tipton, J. Chronic Dis., 1966, 19, 545-571.
- B.B. North, J.M. Leichsenring, L.M. Norris, J. Nutr., 1960, 72, 217-223.
- H. Bowen, Journal of Nuclear Energy, 1956, 3, 18-24.
- J. Lassiter, J. Morton, Journal of animal science, 1968, 27, 776-779.
- W. Dewar, P. Teague, J. Downie, British poultry science, 1974, 15, 119-129.
- S. Smith, M. Medlicott, G. Ellis, Arch. Biochem., 1944, 4, 281-289.
- L. Wachtel, C. Elvehjem, E. Hart, Am. J. Physiol., 1943, 140, 72-82.
- R. Hartman, G. Matrone, G. Wise, J. Nutr., 1955, 57, 429-439.
- A.S. Prasad, Springer, 1978, 191-201.
- G.C. Cotzias, Physiol. Rev., 1958, 38, 503-532.
- S.G. Mairanovskii, Springer, 2013.
- ]K. Saraswathi, K. Meenakumari, K. Padmaja, Transactions-Soc. Adv. Electrochem. Sci. Techno., 1999, 34, 28-29.
- N.V.S. Naidu, K. Dhanalakshmi, A. Hemasundaram, P. Prameela, K. Saraswathi, Transactions-Soc. Adv. Electrochem. Sci. Technol., 2005, 40, 88.
- S. Kanchi, K. Saraswathi, N.V.S. Naidu, Food Analytical Methods, 2012, 5, 69-81.
- N. Venkatasubba Naidu, S. Kanchi, P. Krishnamurthy, K. Saraswathi, Chem. Tech: An Indian J., 2011, 6, 6-12.
- N. Venkatasubba Naidu, S. Kanchi, T. Niranjan, K. Saraswathi, Anal. Chem: An Indian J., 2011, 10, 231-238.
- S. Kanchi, M. Sulochana, K. B. Naidu, K. Saraswathi, N.V.S. Naidu, Food Analytical Methods, 2011, 4, 453-464.
- S. Kanchi, P. Singh, M. I. Sabela, N. V. S. Naidu, K. Bisetty, Int. J. Electrochem. Sci., 2013, 4260.
- S. Kanchi, P. Singh, K. Bisetty, Arabian J. Chem., 2014, 7, 11-25.
- S. Kanchi, M. Sabela, P. Singh, K. Bisetty, Arabian J. Chem., 2017, 10, S2260-S2272.
- T. Niranjan, S. Kanchi, K. Bisetty, N.V.S. Naidu, Asian J. Chem., 2015, 27, 3598.
- N. Thondavada, S. Kanchi, K. Bisetty, V.N Nuthalapati, Int. J. Chemical and Analytical Sci., 2015, 6, 1-7.
- N. Thondavada, S. Kanchi, G. Chembeti, B. Krishna, V.N. Nuthalapati, Asian J. Chem., 2017, 29, 609.
- S. Mairanovskii, J. Electroanalyt. Chem., 1963, 6, 77-118.


