Research Article - Der Pharma Chemica ( 2018) Volume 10, Issue 3
Development and Validation of UV Spectrophotometric Method for the Estimation of Ceftriaxone Sodium in Nanoparticles
Majani Ayushi V and Paradkar Mansi U*
Ramanbhai Patel College of Pharmacy, Charotar University of Science and Technology (CHARUSAT), Changa, Dist. Anand, Ta. Petlad, Gujarat-388421, India
- *Corresponding Author:
- Paradkar Mansi U
Ramanbhai Patel College of Pharmacy
Charotar University of Science and Technology (CHARUSAT)
Changa, Dist. Anand, Ta. Petlad, Gujarat-388421, India
Abstract
The present work describes the simple, accurate and validated UV spectrophotometric method for determination of ceftriaxone sodium loaded in Nanoparticle formulation. The method was validated for different parameters like linearity, precision, specificity, accuracy, Limit of Detection (LOD), Limit of Quantification (LOQ) and Robustness as per ICH guidelines. A wavelength maximum of Ceftriaxone sodium in distilled water was found to be at 241 nm. The method was found to be linear in the range of 2 to 18 μg/ml with a correlation coefficient (r2) of 0.999. The accuracy of the method was studied by recovery study and % recovery was found in range of 99.27 to 100.06%. The method is simple, accurate and requires relatively inexpensive instrument. The proposed method can be successfully used for determination of Ceftriaxone sodium loaded in to Nanoparticle formulation.
Keywords
UV spectrophotometry, Ceftriaxone sodium, %Assay, Chitosan nanoparticles
Introduction
Ceftriaxone sodium is a third generation, semi synthetic cephalosporin antibiotic. Cephalosporins are derivatives of 7-aminocephalosporic acid and are closely related to penicillins in structure. Ceftriaxone sodium is a long acting, broad-spectrum cephalosporin antibiotic for parenteral use. It is effective in treatment of infections caused by accurate bacteria, blood poisoning, meningitis etc. The bactericidal activity of ceftriaxone sodium results from inhibition of cell wall synthesis. It exerts in vitro activity against a wide range of Gram-negative and Gram-positive microorganisms. It is highly stable to most beta-lactamases, both penicillinases and cephalosporinase of Gram-positive and Gram-negative bacteria [1].
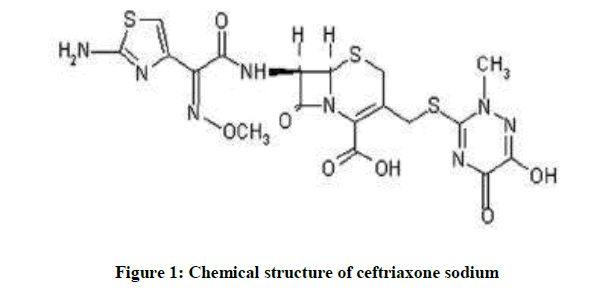
Ceftriaxone sodium is chemically known as, (Z)-7-[2-(2-aminothiazol-4-yl)-2-methoxyiminoacetylamido]-3-[(2,5-dihydro-6-hydroxy-2-methyl- 5-oxo-1,2,4-triazin-3-yl)thiamethyl]-3-cephem-4-carboxylic acid, disodium salt. Ceftriaxone contains a highly acidic, heterocyclic system on the 3-thiamethyl group (Figure 1). This unusual dioxotriazine ring system is believed to confer the unique pharmacokinetic properties of this agent [2].
There are very much significant pharmacological activities exhibited by ceftriaxone sodium, several researchers have focused on the development of various analytical methods to determine ceftriaxone sodium in different matrices such as plasma, urine and saliva [3,4]. The commonly used methods are High Performance Liquid Chromatography (HPLC), spectrofluorimetric and chemilumescence has also been described [2,3,5]. As an alternative to HPLC assays, gas chromatography has also been proposed [6].
In this study, the UV spectrophotometric method was developed and validated for the determination of ceftriaxone sodium loaded into the nanoparticles by evaluating its assay.
Materials and Methods
Equipment
UV- VIS double beam spectrophotometer (Shimadzu UV-1800, Shimadzu Corporation, Japan).
Materials
Ceftriaxone sodium was procured as a gift sample from JFL Life sciences Ltd, Ahmedabad, India. Chitosan used as the polymeric material was purchased from Sigma Aldrich (USA). Sodium Tripolyphosphate (TPP) and Glacial acetic acid were purchased from Loba Chemicals (Mumbai, India) respectively. All other reagents used were of analytical or equivalent grade.
Selection of wavelength maximum (λmax)
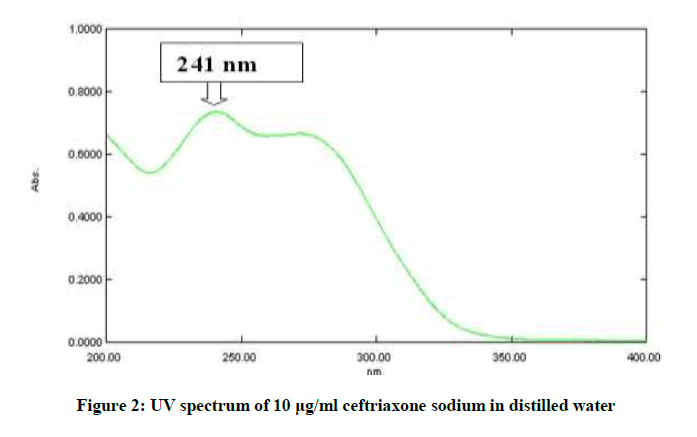
In order to ascertain the wavelength of maximum absorption (λmax) of the drug, a spectrum of 10 μg/ml was recorded using UV-Visible spectrophotometer by scanning in the range of 200 nm to 400 nm against distilled water. The λmax of the drug was noted. The absorption curve showed characteristic absorption maxima at 241 nm for ceftriaxone sodium.
Preparation of stock solution
Accurately weighed (10 mg) of ceftriaxone sodium was transferred to 100 ml amber colored volumetric flask. Small quantity of distilled water was added to ensure complete solubilization of drug and finally volume was made up to the mark with distilled water to produce 100 μg/ml solution.
Preparation of working standard solutions
With the help of pipette, 0.1 ml aliquot was withdrawn from stock solution and transferred to 10 mL amber colored volumetric flask. It was then diluted up to 10 ml with distilled water to produce 1 μg/mL solution. Similarly solutions of concentration 2, 6, 10, 14 and 18 μg/ml were prepared which were used for the construction of calibration curve.
Preparation of ceftriaxone sodium loaded in nanoparticles [7-9]
The formulation was prepared by Ionic crosslinking method. 2 mg/ml chitosan was dissolved in 2% glacial acetic acid solution. 1 mg/ml Sodium Tripolyphosphate (TPP) and drug was added in 10 ml of double distilled water. TPP solution was added to chitosan solution drop by drop at 0.5 ml/min under constant stirring at 800 rpm over magnetic stirrer. After complete addition of TPP solution, chitosan dispersion was allowed to cross linked for 100 min.
Preparation of nanoparticle test solution
Nanoparticle dispersion equivalent to 10 mg ceftriaxone sodium was weighed and transferred to 100 ml amber colored volumetric flask separately and the volume was made up to 100 ml with distilled water to produce 100 μg/ml. 1 ml of test solution was diluted up to 10 ml with distilled water and the absorbance of test solution (10 μg/ml) was recorded against distilled water as a blank at 241 nm.
Validation can be defined as establishing documented evidence which provides a high degree of assurance that a particular method will consistently produce a product meeting its predetermined specifications. The method was validated for different parameters like linearity, precision, accuracy, specificity, ruggedness, robustness, limit of detection, limit of quantification and robustness as per the ICH guidelines.
Linearity
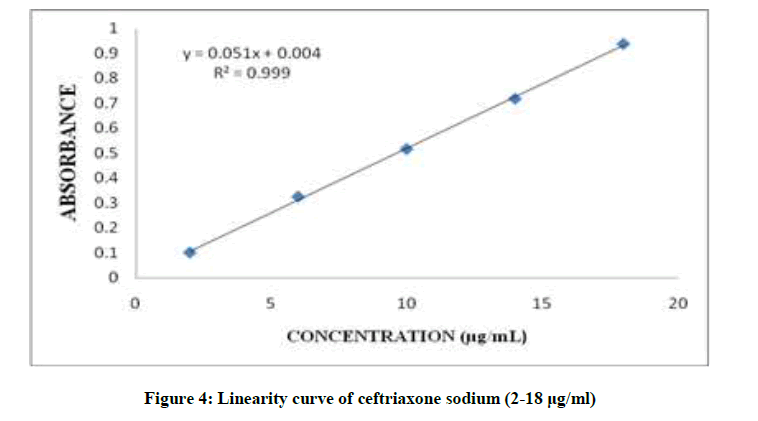
The linearity of an analytical procedure is its ability (within a given range) to obtain test results which are directly proportional to the concentration (amount) of analyte in the sample. For linearity study, six solutions of different concentration (2, 6, 10, 14 and 18 μg/ml) were prepared from the stock solution by withdrawing aliquots with the help of pipette and transferring to separate 10 ml amber coloured volumetric flasks and making volume up to the mark with distilled water. The absorbance of the solutions was measured at 241 nm. A graph of concentration versus absorbance was plotted and correlation coefficient (r2) was calculated.
Precision
The precision of an analytical procedure expresses the closeness of agreement between a series of measurements obtained from multiple sampling of the same homogeneous sample under the prescribed conditions. Precision of the method was determined in terms of repeatability and intra-day and inter-day precision. Repeatability expresses the precision under the same operating conditions over a short interval of time. Repeatability of the method was determined by analyzing six samples of same concentration of drug. For intra-day and inter-day precision studies six solutions of different concentration (2, 6, 10, 14 and 18 μg/ml) were prepared and analyzed three times a day and the same procedure was followed for next two days. The results were reported in terms of % standard deviation, % RSD.
Specificity
The specificity of an analytical method represents its ability to assess unequivocally the analyte in presence of components which are expected to be present. It was checked by comparing the spectra of standard drug solution and nanoparticle test solution.
Accuracy
The accuracy of an analytical procedure expresses the closeness of agreement between the value which is accepted either as a conventional true value or an accepted reference value and the value found. Recovery study was performed by standard addition method at three levels i.e. 80%, 100% and 120%. At each level, the determination was done in triplicate and the amount of drug recovered was calculated.
Limit of Detection (LOD)
It is the lowest concentration of analyte in sample that can be detected but not necessarily quantified. It was calculated based on standard deviation of response and slope of the curve using following equation:
LOD = 3.3 σ/s
Where, σ-standard deviation of the response, s-Slope of curve.
Limit of Quantification (LOQ)
It is the minimum concentration of analyte that can be quantified with suitable precision. It was calculated using following equation:
LOQ = 10 σ/s
Where, σ-is standard deviation of response, s-Slope of curve.
Robustness
The robustness of an analytical procedure is a measure of its capacity to remain unaffected by small, but deliberate variations in method parameters and provides an indication of its reliability during normal usage. It was done by measuring absorbance of a 10 μg/mL solution at detection wavelength 241 ± 2 nm. Each measurement was done in triplicate.
Solution stability
For stability study solution was stored at room temperature for 24 h. The initial absorbance and absorbance at 24 h was measured and the difference was noted. The similarity factor was calculated as follows:

Results and Discussion
Selection of wavelength maximum (λmax)
The UV spectrum of ceftriaxone sodium in distilled water has maximum absorption (λmax) at 241 nm as per shown in Figure 2. The absorbance of excipients in Nanoparticle solution did not interfere with ceftriaxone sodium. As a result, 241 nm wavelengths was selected for quantitative analysis and validation of ceftriaxone sodium in nanoparticles.
Linearity
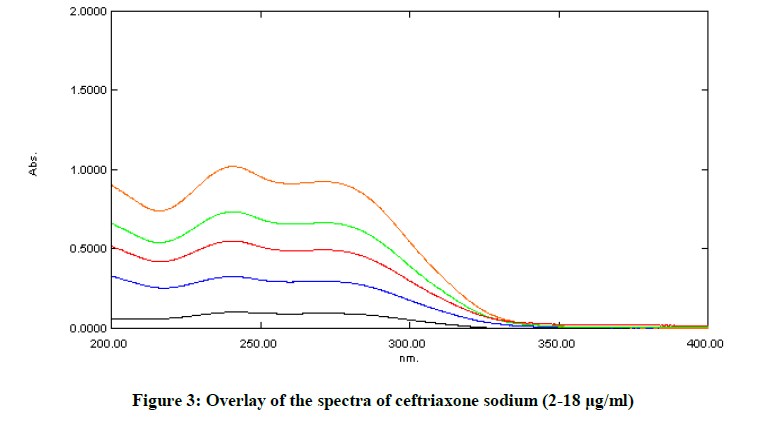
The drug obeyed Beer-Lambert’s law in the concentration range of 2-18 μg/ml with regression 0.999 at 241 nm with %RSD < 2% shown in Table 1. Overlay spectra of Ceftriaxone sodium are shown in Figure 3 and calibration curve is shown in Figure 4.
| Concentration (mg/ml) | Mean response ± SD (n=6) | %RSD |
|---|---|---|
| 2 | 0.1028 ± 0.00097 | 0.9838 |
| 6 | 0.3263 ± 0.00487 | 1.5099 |
| 10 | 0.517 ± 0.005 | 0.58164 |
| 14 | 0.7187 ± 0.00843 | 1.17901 |
| 18 | 0.9381 ± 0.00236 | 0.25284 |
| Linearity Equation | y=0.051x + 0.004 | |
| Correlation Coefficient | 0.999 | |
| Slope | 0.051 | |
| Intercept | 0.004 |
Table 1: Linearity of ceftriaxone sodium (2-18 μg/ml) (λmax.: 241 nm)
Precision
The developed method was found to be precise as the %RSD values for intraday (Table 2.1) and interday (Table 2.2) precision were found within limit (< 2%). Repeatability expresses the precision under the same operating conditions over a short interval of time. So, as per Table 3 this method is repeatable.
| Conc. (μg/ml) |
Absorbance | Concentration (μg/ml) |
Mean absorbance ± SD (n=6) | Mean concentration ± SD | %RSD |
|---|---|---|---|---|---|
| 2 | 0.1026 | 1.9333 | 0.1028 ± 0.0009 | 1.937 ± 0.0190 | 0.9838 |
| 0.1039 | 1.9588 | ||||
| 0.102 | 1.9215 | ||||
| 10 | 0.5169 | 10.0568 | 0.5170 ± 0.005 | 10.124 ± 0.0588 | 0.5816 |
| 0.5221 | 10.1588 | ||||
| 0.5121 | 10.1588 | ||||
| 18 | 0.810 | 18.3333 | 0.9381 ± 0.0023 | 18.317 ± 0.0463 | 0.2528 |
| 0.805 | 18.3529 | ||||
| 0.798 | 18.2647 |
Table 2.1. Intraday precision
| Conc. (μg/ml) |
Absorbance | Conc. (μg/ml) | Mean absorbance ± SD | Mean concentration ± SD | %RSD |
|---|---|---|---|---|---|
| 2 | 0.105 | 1.9803 | 0.1050 ± 0.0009 | 1.9801 ± 0.02 | 1.0100 |
| 0.106 | 2 | ||||
| 0.1042 | 1.96 | ||||
| 10 | 0.5123 | 9.9745 | 0.5070 ± 0.0048 | 9.8659 ± 0.0997 | 1.0107 |
| 0.5061 | 9.845 | ||||
| 0.5027 | 9.7784 | ||||
| 18 | 0.9402 | 18.3568 | 0.9256 ± 0.0039 | 18.2673 ± 0.0775 | 0.4247 |
| 0.9335 | 18.2254 | ||||
| 0.9332 | 18.2196 |
Table 2.2. Interday precision
Table 2: Precision
| Repeatability | |||
|---|---|---|---|
| S. No. | Conc. (μg/ml) | Absorbance | Conc. (μg/ml) |
| 1 | 10 | 0.5129 | 9.9784 |
| 2 | 0.5225 | 10.1666 | |
| 3 | 0.5199 | 9.9588 | |
| 4 | 0.5243 | 10.2019 | |
| 5 | 0.5174 | 10.0666 | |
| 6 | 0.5214 | 10.1450 | |
| Mean | 0.5197 | 10.0862 | |
| S.D. | 0.0040 | 0.1015 | |
| R.S.D. | 0.7860 | 1.0066 | |
Table 3: Repeatability
Specificity
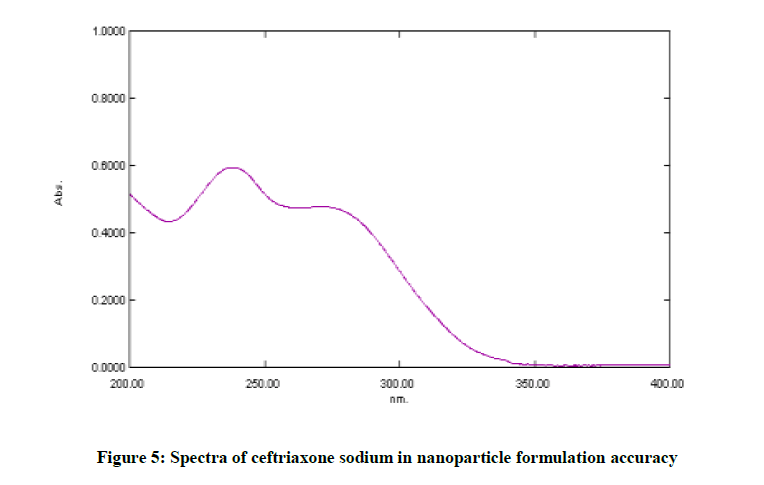
The excipients in nanoparticles did not interfere with absorbance of ceftriaxone sodium which indicates that the method is specific as shown in Figure 5.
Recovery study shows that the overall % recovery was found to be 99.83% as per in Table 4. So, this method is accurate.
| Accuracy | |||||||
|---|---|---|---|---|---|---|---|
| Level of recovery | Sample concentration (μg/ml) | Std. Added (μg/ml) | Total amount (μg/ml) |
Absorbance | Amount recovered |
%Recovery | Mean % recovery |
| 80 | 5 | 4 | 9 | 0.4592 | 8.9254 | 99.17 | 99.27 |
| 5 | 4 | 9 | 0.4599 | 8.9392 | 99.32 | ||
| 5 | 4 | 9 | 0.46 | 8.9411 | 99.34 | ||
| 100 | 5 | 5 | 10 | 0.5122 | 9.0647 | 99.64 | 99.73 |
| 5 | 5 | 10 | 0.513 | 9.0647 | 99.8 | ||
| 5 | 5 | 10 | 0.5128 | 9.9803 | 99.76 | ||
| 120 | 5 | 6 | 11 | 0.569 | 11.078 | 100.7 | 100.6 |
| 5 | 6 | 11 | 0.5684 | 11.0666 | 100.6 | ||
| 5 | 6 | 11 | 0.5639 | 11.05686 | 100.51 | ||
Table 4: Accuracy
LOD
LOD calculated using the equation as mentioned earlier is 0.336805 μg/ml.
LOQ
LOQ calculated using the equation as mentioned earlier is 1.020621 μg/ml.
Robustness
The method was found to be robust when checked for the effect of change in detection wavelength (Table 5).
| Robustness | ||||||
|---|---|---|---|---|---|---|
| Concentration (μg/ml) | Absorbance | Concentration (μg/ml) |
%Assay | |||
| 10 | 239 nm | 243 nm | 239 nm | 243 nm | 239 nm | 243 nm |
| 0.5094 | 0.512 | 9.9098 | 9.9607 | 99.09 | 99.6 | |
| 0.5102 | 0.5108 | 9.9254 | 9.9372 | 99.25 | 99.37 | |
| 0.5099 | 0.5106 | 9.9196 | 9.9333 | 99.19 | 99.33 | |
| Average | 0.5098 | 0.5111 | 9.9182 | 9.9437 | 9.9437 | 99.1766 |
| S.D. | 0.0004 | 0.0007 | 0.0078 | 0.0148 | 0.0148 | 0.0808 |
| RSD | 0.0792 | 0.0792 | 0.0794 | 0.1490 | 0.1490 | 0.0815 |
Table 5: Robustness
Solution stability
The stability of solution was evaluated by determining similarity factor (0.995) which was found within the acceptance criteria of 0.98-1.02. The developed method was found to be precise, specific and accurate (Table 6).
| Solution stability | |||||||
|---|---|---|---|---|---|---|---|
| Concentration (μg/ml) | Initial absorbance | Initial concentration (μg/ml) | Initial assay (%) | Absorbance after 24 h | Concentrate-ion after 24 h | %Assay after 24 h | Difference in % assay |
| 10 | 0.5067 | 9.8568 | 98.56 | 0.5095 | 9.9117 | 99.11 | 0.55 |
| 0.5059 | 9.8411 | 98.41 | 0.5079 | 9.8803 | 98.8 | 0.39 | |
| 0.5053 | 9.8294 | 98.29 | 0.5069 | 9.8607 | 98.6 | 0.31 | |
Table 6: Solution stability
The overall summary of validation parameters is shown in Table 7.
| Summary of validation parameters | |
|---|---|
| Parameter | Ceftriaxone sodium loaded nanoparticles |
| λmax | 241 nm |
| Linearity | 2 to 18 μg/ml |
| Equation | y=0.051x + 0.004 |
| R2 | 0.999 |
| LOD | 0.336805 |
| LOQ | 1.02062 |
| Repeatability (%RSD, N=6) | 0.7860 |
| Intraday precision (%RSD, N=3) | 0.6060 |
| Interday precision (%RSD, N=3) | 0.8151 |
| % Recovery | 99.83 |
| Standard solution stability (Similarity factor) | 0.995 |
Table 7: Summary of validation parameters
Conclusion
The proposed UV-Spectrophotometry method for estimation of ceftriaxone sodium in pharmaceutical dosage form that is nanoparticles was successfully developed and validated for its intended purpose. The method was shown to be linear, precise, repeatable, specific, accurate, robust and stable. Therefore it can be used for the determination of ceftriaxone sodium loaded into Nanoparticles.
Acknowledgement
We are thankful to JFL Life sciences Ltd, (Ahmedabad, India) for providing the gratis sample of Ceftriaxone sodium. We are also thankful toRamanbhai Patel College of Pharmacy, CHARUSAT for providing us the required facilities.
References
- R. Ethiraj, E. Thiruvengadam, V.S. Sampath, A. Vahid, J. Raj, Inter. Scholarly Research Notices., 2014, 24.
- B. Hiremath, B.H. Mruthyunjayaswamy, Anal. Lett., 2009, 42(14), 2180-2191.
- D. Zhang, M. Zhou, L. Li, H. Chen, Anal. Sci., 2006, 22(1), 183-186.
- V. Ascalone, L. Dal Bo, J. Chromatogr. B., 1983, 273(2), 357-366.
- M.A. Omar, O.H. Abdelmageed, T.Z. Attia, Talanta., 2009, 77(4), 1394-1404.
- F.E. Ling, L.I. Yan, Pharmacy Today., 2009, 10, 017.
- International Conference on Harmonization, Draft Guideline on Validation Procedure, Definition and Terminology Federal Register, 60, 1995.
- Validation of analytical procedures: text and methodology: International Conference on Harmonization (ICH), Q2(R1), Geneva, Switzerland, 2005.
- H. Liu, C. Gao, Polymers For Advanced Technologies., 2009, 20(7), 613-619.

