Research - Der Pharma Chemica ( 2022) Volume 14, Issue 2
Development and Validation of a Simple and Rapid UV Spectrophotometeric Method for Linagliptin in Bulk and Marketed Dosage Form
Amruta Dalal*, Dr.Varsha Tegeli and Rajashri WaghmodeAmruta Dalal, Department of Pharmaceutical Quality Assurance, D.S.T.S Mandal’s College of Pharmacy, Solapur, India, Email: amrutadalal37@gmail.com
Received: 23-Jan-2022, Manuscript No. dpc-22-52220; Accepted Date: Jan 25, 2022 ; Editor assigned: 25-Jan-2022, Pre QC No. dpc-22-52220; Reviewed: 10-Feb-2022, QC No. dpc-22-52220; Revised: 17-Feb-2022, Manuscript No. dpc-22-52220; Published: 25-Feb-2022
Abstract
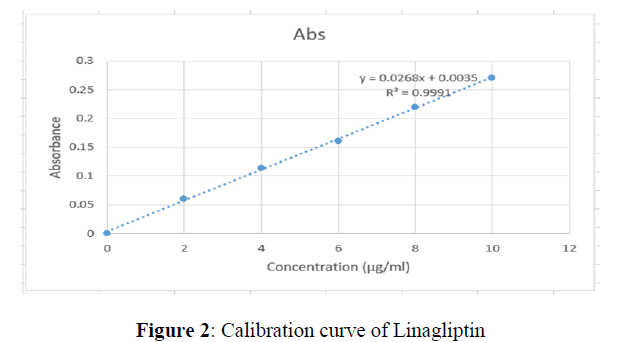
A simple, rapid, accurate and precise UV spectrophotometric Method for Linagliptin in Bulk and marketed tablet dosage form has been developed. The λmax of Linagliptin was found to be 295 nm. The method was linear in the range of 2-10 μg/ml presenting a good correlation coefficient (R2 = 0.9991). Method is validated as per ICH guideline and statistically significant as all the statistical parameters are within the acceptance range (%RSD ? 2.0 and SD ? 2. 0) for both Accuracy and precision.
Keywords
Linagliptin; UV - method; Development; Validation; Spectrometric method
Introduction
Linagliptin is a dipeptidyl peptidase4, also DPP-4 inhibitor developed by Boehringer Ingelheim for the treatment of type II diabetes. Linagliptin differs from other DPP-4 inhibitors in that it has a non-linear pharmacokinetic profile, is not primarily eliminated by the renal system, and obeys concentration dependent protein binding. tables 1-5 Linagliptin was approved by the FDA on May 2, 2011[1].
| Sr. No | Conc. (µg/ml) | Absorbance |
|---|---|---|
| 1 | 0 | 0 |
| 2 | 2 | 0.060 |
| 3 | 4 | 0.114 |
| 4 | 6 | 0.161 |
| 5 | 8 | 0.219 |
| 6 | 10 | 0.270 |
| Parameters | Methods |
|---|---|
| Wavelength detection | 295 nm |
| Range | 2-10 µg/ml |
| Correlation coefficient (r2) | 0.9991 |
| Regression equation (y=mx+c) | Y=0.0268x+0.0035 |
| Slope (m) | 0.0268 |
| Intercept (c) | 0.0035 |
| LOD | 0.3271 µg/ml |
| LOQ | 0.9909 µg/ml |
| Conc. (µg/ml) | Intraday precision of Linagliptin | Interday precision of Linagliptin | ||||
|---|---|---|---|---|---|---|
| Absorbance | Absorbance mean ± SD (N=3) | %RSD | Absorbance | Absorbance mean ± SD (N=3) | %RSD | |
| 2 | 0.061 | 0.051 | ||||
| 0.063 | 0.06167 ± 0.00116 | 1.8725 | 0.050 | 0.05067 ±0.00058 | 1.1396 | |
| 0.061 | 0.051 | |||||
| 6 | 0.171 | 0.183 | ||||
| 0.169 | 0.17067± 0.001528 | 0.8950 | 0.180 | 0.162 ± 0.003 | 1.8518 | |
| 0.172 | 0.182 | |||||
| 10 | 0.282 | 0.267 | ||||
| 0.285 | 0.28234± 0.002517 | 0.8913 | 0.260 | 0.00360 ± 0.00360 | 1.3658 | |
| 0.280 | 0.265 | |||||
| Sr.No | Conc. (µg/ml) | Absorbance |
|---|---|---|
| 1 | 10 | 0.271 |
| 2 | 10 | 0.278 |
| 3 | 10 | 0.279 |
| 4 | 10 | 0.272 |
| 5 | 10 | 0.276 |
| 6 | 10 | 0.271 |
| Mean | 0.2745 | |
| SD | 0.003619 | |
| % RSD | 1.31854 | |
| Sr. No | Level Recovery |
% Recovery ± SD | % RSD |
|---|---|---|---|
| 1 | 50% | 97.09 ± 0.01 | 0.0103 |
| 2 | 100% | 97.90 ± 0.0057 | 0.005897 |
| 3 | 150% | 98.17 ± 0.0057 | 0.005881 |
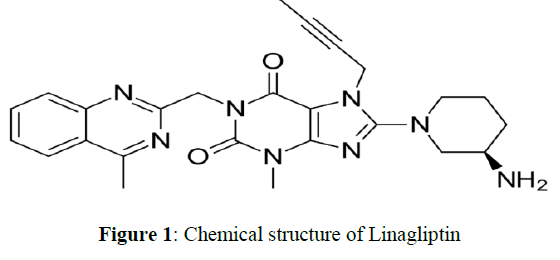
Linagliptin is described chemically as 1H-purine-2, 6-dione, 8-[(3R)-3-amino-1-piperidinyl]-7-(2-butyl-1-yl)-3, 7-dihydro-3-methyl-1[(4-methyl-2-quinazolinyl) methyl]. The empirical formula is C25H28N8O2 and the molecular weight is 472.5. The structural formula is shown in figure 1&2. Linagliptin is a white to yellowish substance. It is very slightly soluble in water. Linagliptin is soluble in methanol, sparingly soluble in ethanol, very slightly in isopropanol and very slightly soluble in acetone [2].
Materials and Method
Materials
Linagliptin was obtained as a gift sample from Micro Labs Ltd. Bangalore, INDIA. Tablets of Ondero were purchased from local market; each tablets was labeled to contain 5 mg of Linagliptin. All chemicals and regents were of analytical.
Instruments
A single beam UV Visible Spectrophotometer (Systronic-119 Spectrophotometer) was used for the detection of absorbance, and Weighing Balance (SHIMADZU AY220) used for experimental purpose.
Chemical and Reagent
Disilled methanol, distilled water, whatman filter paper were used.
Method Development
Selection of solvent
Solubility of Linagliptin was performed in solvent methanol and UV spectra of drug in this solution were recorded. The absorbance value of drug was higher at λmax with methanol as a solvent. Hence, methanol was selected as a solvent for further investigation as it is more economical.
Determination of Wavelength
An UV Spectrophotometric scanning (200-400) was carried out to select the wavelength (λmax) for detection of Linagliptin, because of every drug should have adequate absorbance in the same solvent for the simultaneous determination.
Preparation of Standard stock solution
Weigh accurately about 10 mg of Linagliptin pure drug into a clean and dry 10 ml of volumetric flask. Dilute with 6 ml of distilled methanol (used as solvent) and shake well. Then the makeup volume to the mark with the same solvent. Further pipette out 1 ml of Linagliptin stock solution into a 10 ml of volumetric flask and dilute up to the mark with diluent (100μg/ml) [3].
Preparation of Sample Stock Solution
Twenty tablets were weighed accurately and their average weight was determined and crushed to powder. Then weigh accurately about 10 mg of powder sample into a clean and dry 10ml volumetric flask. Diluted with 10 ml of methanol. Then the volume was made up to 10 ml using methanol and mix well. Filter the solution through whatman filter paper. After filtration an aliquot of 0.4ml of this solution was transferred into a clean 10 ml volumetric flask and the volume was adjusted upto the mark with methanol. Absorbance of this solution at 295 nm was recorded [4].
Preparation of Calibration curve
Aliquots of 10 μg/ml from the standared stock of solution of Linagliptin were pipette into a six series of 10 ml of volumetric flasks. Then the mixture was serially with distilled methanol to get a Linagliptin solutions 2,4,6,8 and 10 μg/ml the content of each flask were mixed and immediately transferred to the spectrophotometric cell. The absorbance was recorded at its λmax nm.
Validation of method as per ICH guidelines [5-7]
Linearity
The linearity of the purposed UV spectroscopic method was evaluated by analyzing different concentrations of standard solution of Linagliptin and by plotting absorbances of analyte against concentration of analyte. Beer’s law was obeyed for method in the concentration range of 2-10 μg /ml. The linearity was evaluated by linear regression analysis, which was calculated by the least square regression method.
Precision
Precision studies were carried out to ascertain the reproducibility of the proposed Method. Intraday Precision study was carried out by preparing drug solution of three different concentrations (0.2, 0.6 and 1μg/ml of Linagliptin) and analyzing it at three different times in a day. Interday precision Study was carried out by preparing drug Solution of three different concentration (0.2, 0.4, and1μg/ml) and analyzing it at three different days.
Accuracy
The accuracy is the measure of how close of experimental value is to the true value. The recovery study was carried out as 50%, 100%, and 150% of the test concentration as ICH Guidelines. The recovery study was performed three times at each level. Accuracy was determined and expressed as percent recovery. Limit of detection: (LOD)
Limit of detection is defined as the lowest concentration of analyte that gives a detectable response. LOD was determined by the analysis of sample with known concentration of analyte and by establishing and minimum level at each the analyte can be reliably detected.
LOD was calculated using the following equation.
LOD = 3.3 × So/b,
Where, So and b are standard deviation of the response and the slope of calibration curve.
Limit of Quantification: (LOQ)
LOQ was determined by the analysis of samples with known concentrations of analyte and by establishing the minimum level at which the analyte
could be quantified with acceptable accuracy and precise.
LOQ was calculated using the following equations.
LOQ =10 × So/b,
Where, So and b are the standard deviation of the response and the slope of the calibration curve.
Result and Discussion
The main purpose of the current method is to develop a simple, sensitive and precise UV- Vis spectrophotometric method for the assessment of Linagliptin for the routine quantitative estimation of samples which will reduce dreary sample preparations, cost of resources manpower obligatory to perform analysis. The spectral analysis indicated that the λmax of Linagliptin is 295 nm. Simple diluent distilled methanol was selected for the standard and sample solution of Linagliptin drug substance. Thus, the established UV-Vis spectroscopic method for the analysis of Linagliptin in its API from enables analysis of several samples at the same time to its simplicity in performing the analysis.
Conclusion
The developed UV spectrophotometric method was found to be simple, accurate, precise, easy, economic, reproducible and highly sensitive and can be used for routine determination of Linagliptin in bulk and tablet formulation.
Acknowledgements
The authors are thankful to the Micro Lab Ltd. Bangalore, India for providing gift sample of Linagliptin. We also grateful to Principal and management of D.S.T.S. Mandal’s College of Pharmacy, Solapur for providing all facilities to complete this work successfully.
References
- Linagliptin. Drug bank.
- Sujan Banik, Masud Kaisar MD and Mohammad Salim Hossain. Indian J Nov Drug Delivery. 2013, 5(4): p. 221-224.
- Linagliptin Structure.
- Four phase III Trials Confirm Benefits of BI’s Oral, Once-Daily Type 2 Diabetes Therapy. Genet Eng Biotechnol News. 2010.
- Spritzers H. Osterreichische Apothekerzetzeitung, 2008, 918.
- Kavitha KY, Geetha G, Hariprasad R et al., J Chem pharm Res. 2013, 5(1):230-235.
- Vijaya Sri K, Vinay Jain G and Maduri M. Res J Pharm Technol. 2014, 7(4).
Indexed at, Google Scholar, Crossref


