Research Article - Der Pharma Chemica ( 2018) Volume 10, Issue 3
Chemometric Methods for Simultaneous Determination of Bisoprolol, Hydrochlorothiazide and Ramipril in Ternary Combinations
Shoeb Alahmad*, Hamed M Elfatatry, Mokhtar M Mabrouk, Sherin F Hammad and Fotouh R Mansour
Department of Pharmaceutical Analytical Chemistry, Faculty of Pharmacy, Tanta University, Tanta-31111, Egypt
- *Corresponding Author:
- Shoeb Alahmad
Department of Pharmaceutical Analytical Chemistry
Faculty of Pharmacy
Tanta University
Tanta-31111, Egypt
Abstract
Spectrophotometric methods for the simultaneous determination of Bisoprolol (BIS), Hydrochlorothiazide (HCT) and Ramipril (RAM) in their dosage form were developed. These methods are chemometric based on treatment of data, the applied chemometric techniques are multivariate methods including Classical Least Squares (CLS), Principal Component Regression (PCR) and Partial Least Squares (PLS). In these techniques, the concentration data matrix were prepared by using the synthetic mixtures containing the three drugs dissolved in 0.1 M NaOH. The absorbance data matrix corresponding to the concentration data matrix was obtained by measuring the absorbance in the range 235-245 nm at 1 nm intervals in the zero-order. The spectrophotometric procedures are simple, do not require any separation step. The developed methods were validated by calculating validation diagnositics after analyzing dosage form containing the studied drugs. The developed methods were successfully applied routinly in quality control laboratory.
Keywords
Multivariate analysis, Spectrophotometry, Numerical analysis, Chemometric techniques, Bisoprolol, Hydrochlorothiazide, Ramipril
Introduction
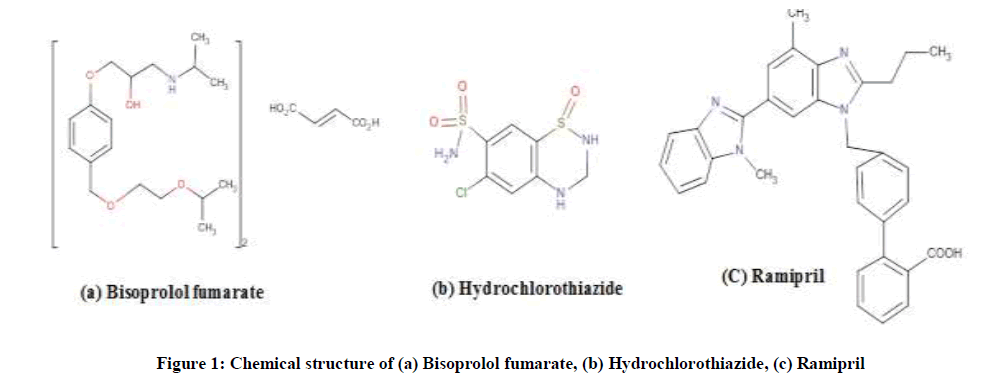
Bisoprolol Fumarate (BIS) (±)-1-[4-[[2-(1-Methylethoxy)ethoxy]methyl]phenoxy]-3[(1-methylethyl) amino]-2-propenol(E)-2-butenedioate (Figure 1a), a USP official drug [1], is antihypertensive agent by blocking beta receptors as selective blocker [2]. Hydrochlorothiazide (HCT), 6- chloro-3,4-dihydro-2H-1,2,4-benzothiazine-7-sulfonamide,1,1-dioxide (Figure 1b), is a thiazide diuretics and it is used in the as anti-hypertensive either alone or with other antihypertensive drugs such as beta blockers. It affects by reducing the reabsorption of electrolytes from the renal tubules, along these lines expanding the discharge of sodium and chloride particles and consequently, of water [2].
Ramipril (RAM) is 2-[N-[(S)-1-(ethoxycarbonyl)-3-phenylpropyl)]-L-alanyl](1S,3S,5S)-2-azabicyclo[3-3-0]octane carboxylic acid (Figure 1c), RAM is an Angiotensin-converting Enzyme (ACE) inhibitor. It effects on the renin-angiotensin system. It inhibits the transformation of the dormant angiotensin I to the vasoconstrictor, angiotensin II, and reduces the corruption of bradykinin [3]. RAM is an effective agent for the management of hypertension, treatment of heart failure, drug for prophylaxis from cardiovascular events in high risk patients [4].
Literature review reveled different analytical methods for the determination of RAM, HCT and BIS either individually or in combination with other drugs. These methods include spectrophotometric method for determination of RAM, HCT with telmisartan [5], chemometric method for determination of RAM, HCT and irbesartan [6], High Performance Liquid Chromatography (HPLC) [7-9] and thin layer chromatographic method for determination of BIS and HCT [10].
There is only one method for the simultaneous determination of RAM, HCT and BIS this method is based on HPLC [11]. bisoprolol, hydrochlorothiazide and ramipril are formulated together in Combitrust® capsule, each capsule contains (2.5, 12.5 and 2.5) mg, respectively. This dosage form has been lunched in the Egyptian market since 2017. The current study present chemometric methods for the simultaneous determination of BIS, HCT and RAM in their dosage form. These methods are multivariate including Classical Least Squares (CLS), Principal Component Regression (PCR) and Partial Least Squares (PLS). Chemometrics is the treatment of information with different numerical procedures. Chemometrics methods remove the noise from data, and use the pure information to make predictions about unknown samples [12,13]. Chemometric techniques use PC help and statistics for the determination of multicomponent drugs. A few number of calibration methods are available with economic commercial software is used with existing instruments. The most popular chemometric methods include PCR and PLS.
Chemometric techniques are useful for the resolution of spectral overlapping in quantitative determination during the analysis of multicomponent drugs [14,15]. The developed methods have not been done before. This methods are less expensive by comparison with HPLC methods and do not require special instrumentation nor any prior tedious separation steps.
Experimental Section
Apparatus and software
A Shimadzu (UV-1800) UV-Visible double beam spectrophotometer equipped with 1 cm quartz cells and connected to a personal computer loaded with UV-probe 2.33 software was used. CLS, PCR, and PLS analyses were carried out using the Chemometrics Toolbox 3.02 software (Kramer, 1995) for use with MATLAB 6 [16].
Materials
Pure drugs
Bisoprolol fumarate was manufactured by Smaart Pharmaceuticals with purity 99.23%. Hydrochlorothiazide was manufactured by Santic with a purity of 100.2% and Ramipril was manufactured by Sigma-Aldrich Co., Schnelldorf, Germany with a purity of 99.8%. These drug substances were kindly supplied by Pharmadar Pharmaceutical CO. Elsadat, Menofia, Egypt. The pharmaceutical dosage form Combitust® capsules containing 2.5 mg BIS, 12.5 mg HCT and 2.5 mg RAM, was kindly supplied by Pharmadar Pharmaceutical CO. Elsadat, Menofia, Egypt.
Standard solutions and calibrations
Stock standard solutions
A stock standard solution (400 μg/ml) of each drug was prepared in 0.1 M NAOH.
Working standard solutions
A 50 μg/ml working standard solution of each drug was prepared by diluting 12.5 ml of each drug stock solution to 100 ml by 0.1 M NAOH.
Training set
A training set of fifteen synthetic ternary mixture solutions in combinations containing 2.5-50 μg/ml (BIS), 2-25 μg/ml (HCT) and 2.5-50 μg/ml (RAM) were used to optimize the chemometric calibrations.
Validation set
A validation set of fifteen synthetic ternary mixtures in the range of 2.5-30, 2-25 and 2.5-30 μg/ml for BIS, HCT and RAM, respectively were prepared by taking different aliquots from the working standard solutions of the three drugs and diluted with 0.1 M NAOH.
Assay of Combitrust® capsules (Dosage form)
The contents of ten capsules of the dosage form Combitrust®, were weighted, powdered and mixed together. An amount of the powder equivalent to the content of one capsule was transferred into a 100 ml volumetric flask, dissolved in 0.1 M NAOH. The solution was completed to volume with the same solvent, sonicated for 15 min. Filtration was carried out to the solution using 0.22 μm membrane filter. 5.0 ml of this filtrate was transferred to 25 ml and finally completed to volume with the same solvent to give a final concentration of 5, 25 and 5 μg/ml of bisoprolol, hydrochlorothiazide and ramipril, respectively.
Multivariate methods
The UV absorbance of the mixtures was recorded within the wavelength range 235-245 nm at 1 nm intervals.
Results and Discussion
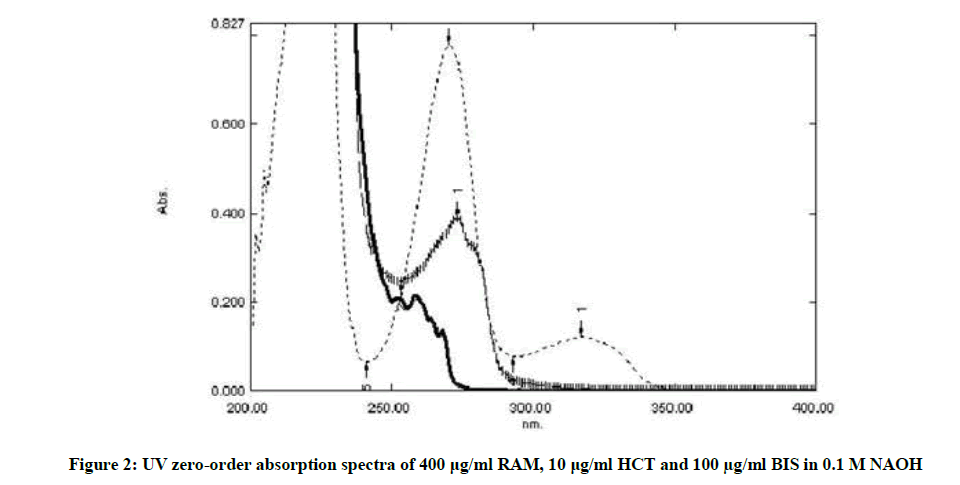
The spectra of BIS, HCT and RAM were recorded. Figure 2 shows sever overlap between the three drugs. It was noticed during the development of chemometric techniques for the determination of these drugs that the optimum conditions were gotten by measuring the absorbance between 235– 245 nm at 1 nm interval. Fifteen mixtures were used in the calibration set according the rule of five. This rule expresses that uses five times the number of samples as there are components so it gives enough samples to represent all possible combinations of different concentration values [12]. A training set (Calibration set) was prepared as shown in Table 1.
| Mixture No | RAM (µg/ml) | HCT (µg/ml) | BIS (µg/ml) |
|---|---|---|---|
| 1 | 2.5 | 12.5 | 2.5 |
| 2 | 5 | 7.5 | 5 |
| 3 | 7.5 | 5 | 7.5 |
| 4 | 2.5 | 5 | 6 |
| 5 | 5 | 10 | 7.5 |
| 6 | 10 | 12.5 | 5 |
| 7 | 12.5 | 5 | 10 |
| 8 | 15 | 5 | 10 |
| 9 | 10 | 5 | 25 |
| 10 | 25 | 5 | 10 |
| 11 | 5 | 25 | 5 |
| 12 | 12.5 | 2 | 12.5 |
| 13 | 15 | 1.5 | 15 |
| 14 | 20 | 10 | 50 |
| 15 | 50 | 10 | 20 |
Table 1: Mixtures of bisoprolol, hydrochlorothiazide and ramipril used in the training set
The developed calibrations were calculated with the CLS, PCR and PLS algorithms using the correlation for the spectral matrix and the corresponding concentration matrix of the calibration set. Independent validation synthetic mixtures were prepared to validate the calibration set. The validation set compositions are shown in Table 2. In the same way the validation mixtures were analyzed by measuring the absorbance within wavelength range 235-245 nm at 1 nm interval. The assay results of the synthetic mixtures of the validation set are given in Table 2. The results indicate high accuracy and precision of the developed chemometric methods.
| Validation mixtures | Recovery % | ||||||||||
|---|---|---|---|---|---|---|---|---|---|---|---|
| Multivariate methods | |||||||||||
| Conc. (µg/ml) | CLS | PCR | PLS | ||||||||
| RAM | HCT | BIS | RAM | HCT | BIS | RAM | HCT | BIS | RAM | HCT | BIS |
| 5 | 20 | 5 | 99.0 | 100.8 | 102.4 | 101.2 | 100.7 | 102.4 | 101.2 | 100.7 | 102.4 |
| 10 | 15 | 10 | 101.5 | 102.4 | 100.9 | 101.1 | 102.3 | 101.0 | 101.1 | 102.3 | 101.0 |
| 15 | 10 | 15 | 100.5 | 99.9 | 99.7 | 100.1 | 99.9 | 99.7 | 100.1 | 99.9 | 99.7 |
| 20 | 5 | 20 | 101.0 | 101.0 | 101.0 | 100.2 | 101.0 | 101.0 | 100.2 | 101.0 | 101.0 |
| 10 | 20 | 15 | 97.9 | 101.3 | 102.8 | 99.9 | 101.2 | 102.7 | 99.9 | 101.2 | 102.7 |
| 20 | 25 | 10 | 102.5 | 106.8 | 95.1 | 101.7 | 106.7 | 95.2 | 101.7 | 106.7 | 95.2 |
| 25 | 10 | 20 | 98.7 | 101.7 | 102.7 | 97.8 | 101.6 | 102.8 | 97.8 | 101.6 | 102.8 |
| 30 | 10 | 20 | 99.8 | 100.7 | 101.4 | 98.5 | 100.5 | 101.5 | 98.5 | 100.5 | 101.5 |
| 10 | 5 | 25 | 99.5 | 103.0 | 99.8 | 102.3 | 103.2 | 99.7 | 102.3 | 103.2 | 99.7 |
| 25 | 5 | 10 | 103.4 | 101.2 | 98.4 | 101.4 | 100.8 | 98.6 | 101.4 | 100.8 | 98.6 |
| 5 | 25 | 5 | 98.6 | 100.2 | 99.0 | 102.0 | 100.2 | 98.8 | 102.0 | 100.2 | 98.8 |
| 10 | 2 | 10 | 98.6 | 103.5 | 97.9 | 97.6 | 103.5 | 97.9 | 97.6 | 103.5 | 97.9 |
| 20 | 4 | 25 | 98.1 | 97.8 | 103.2 | 97.9 | 97.8 | 103.2 | 97.9 | 97.8 | 103.2 |
| 25 | 3 | 30 | 101.3 | 103.3 | 102.2 | 100.9 | 103.7 | 102.2 | 100.9 | 103.7 | 102.2 |
| 2.5 | 12.5 | 2.5 | 99.1 | 100.2 | 98.8 | 102.4 | 100.2 | 98.8 | 102.4 | 100.2 | 98.8 |
| Mean | 99.9 | 101.6 | 100.3 | 100.3 | 101.5 | 100.4 | 100.3 | 101.5 | 100.4 | ||
| ± S.D. | 1.7 | 2.1 | 2.3 | 1.7 | 2.1 | 2.2 | 1.7 | 2.1 | 2.2 | ||
| R.S.D% | 1.7 | 2.0 | 2.3 | 1.7 | 2.1 | 2.2 | 1.7 | 2.1 | 2.2 | ||
Table 2: Assay results of bisoprolol, hydrochlorothiazide and ramipril combinations in synthetic mixtures of the validation set by the developed multivariate methods
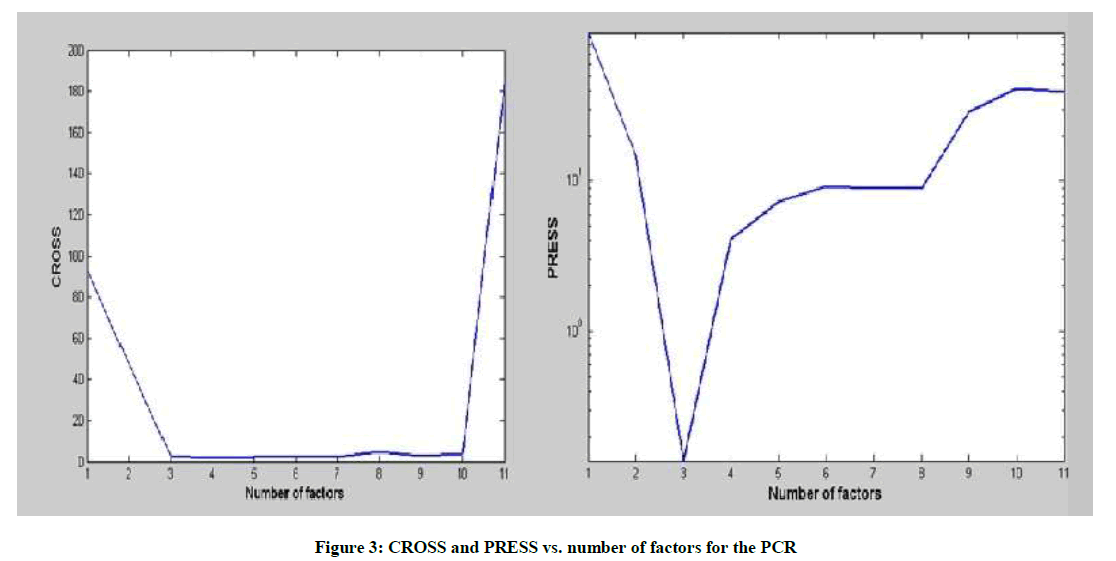
Determining the number of factors during the optimization of the calibration, in order to model the system without over fitting the concentration data in the PLS and PCR algorithms, was detected using several indicators. A cross-validation method, leaving out one sample at a time was employed using training set and the predicted residual error sum-of-squares (PRESS) was calculated.

Where, CiTrue represents the true concentration, CiPredicted denotes the predicted concentration and n is the total number of validation sample. Figure 3 shows the obtained CROSS and PRESS for PCR model.
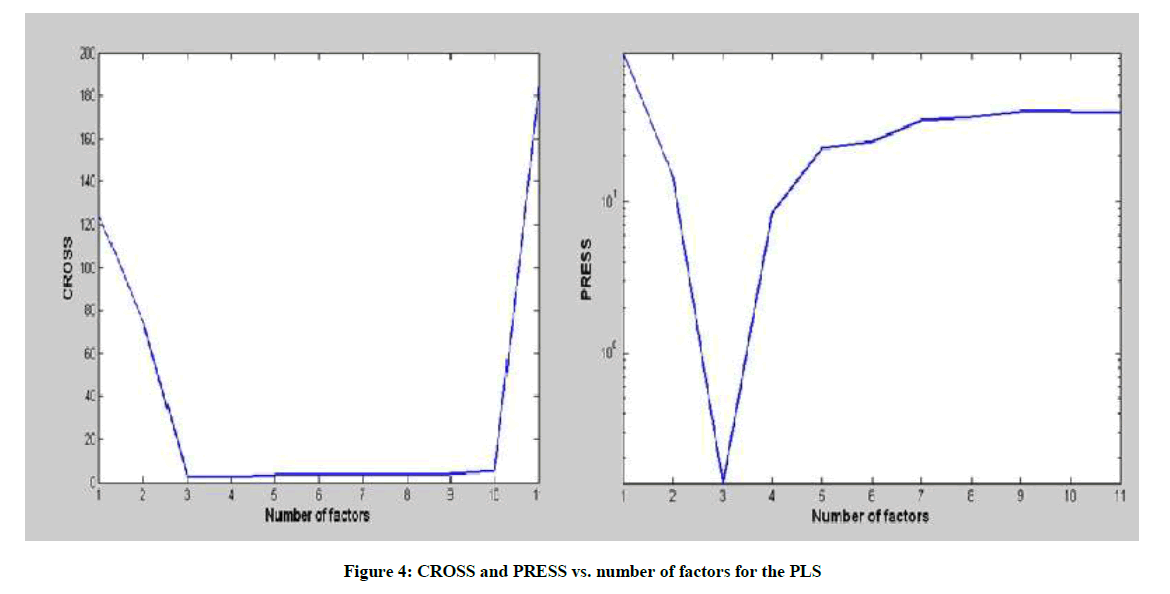
Another indicator to determine the optimum number of factors is the two-way F-test on Reduced Eigenvalues (REV) as indicated by the Malinowski technique [12]. A rank of three factors was found to be the optimum system rank for both the PCR and PLS models as indicated by the three examined indicators. Figure 4 shows the obtained CROSS and PRESS for PLS model.
The predictive ability of the model could be evaluated by validation diagnostics. These include the Standard Error of Prediction (SEP), the Mean Squared Error of Prediction (MSEP), the Root Mean Standard Error of Prediction (RMSEP) and the variance of prediction (S2). The MSEP and RMSEP characterize both the accuracy and the precision of prediction [9]. The values of SEP, MSEP, RMSEP and S2 are indicated in Table 3.
| Method | SEPα | MSEPb | RMSEPc | S2d |
|---|---|---|---|---|
| RAM | ||||
| CLS | 0.32356 | 0.097712 | 0.312589 | 0.1169 |
| PCR | 0.280205 | 0.073281 | 0.270704 | 0.078671 |
| PLS | 0.276647 | 0.071431 | 0.267266 | 0.076543 |
| HCT | ||||
| CLS | 0.482033 | 0.216866 | 0.465688 | 0.378989 |
| PCR | 0.470788 | 0.206865 | 0.454824 | 0.354673 |
| PLS | 0.470785 | 0.206863 | 0.454821 | 0.354619 |
| BIS | ||||
| CLS | 0.380554 | 0.135167 | 0.367651 | 0.208982 |
| PCR | 0.379805 | 0.134635 | 0.366927 | 0.210116 |
| PLS | 0.378929 | 0.134014 | 0.36608 | 0.20854 |


Table 3: Statistical parameters of the validation synthetic mixtures using the proposed chemometric methods
Where, CiTrue is the true concentration, CiPredicted is the predicted concentration and n is the total number of validation samples. The small values of the computed validation diagnostics demonstrate the measly error of prediction and the high predictive ability of the developed methods.
The accuracy and precision were proven by comparing the results got from the assay of Combitrust® capsules using the developed methods to those obtained by reported HPLC method [11]. The results obtained were statistically analyzed and compared using the difference in the mean percentage recovery (t-test) and the variance (F-test) and the results indicate that there was no significant deference (Table 4).
| HPLC | PCR | PLS | CLS | |||||||||
|---|---|---|---|---|---|---|---|---|---|---|---|---|
| BIS | HCT | RAM | BIS | HCT | RAM | BIS | HCT | RAM | BIS | HCT | RAM | |
| 100.94 | 98.85 | 97.56 | 100.03 | 99.41 | 103.15 | 100.03 | 99.40 | 103.22 | 99.86 | 99.47 | 100.13 | |
| 100.17 | 97.79 | 96.77 | 98.52 | 105.06 | 100.70 | 98.52 | 105.08 | 100.55 | 97.08 | 105.15 | 98.62 | |
| 97.85 | 100.29 | 99.14 | 101.35 | 100.19 | 100.76 | 101.32 | 99.61 | 105.77 | 101.82 | 99.74 | 101.42 | |
| Mean | 99.66 | 98.97 | 97.82 | 99.97 | 101.55 | 101.54 | 99.96 | 101.36 | 103.18 | 99.59 | 101.45 | 100.06 |
| S.D | 1.61 | 1.25 | 1.21 | 1.42 | 3.06 | 1.40 | 1.40 | 3.22 | 2.61 | 2.38 | 3.20 | 1.40 |
| R.S.D% | 1.61 | 1.26 | 1.24 | 1.42 | 3.01 | 1.37 | 1.40 | 3.18 | 2.53 | 2.39 | 3.16 | 1.40 |
| F | 1.28 | 5.90 | 1.30 | 1.31 | 6.60 | 4.65 | 2.19 | 6.56 | 1.30 | |||
| t | 0.50 | 1.30 | 2.33 | 0.50 | 1.09 | 1.81 | 0.17 | 1.14 | 1.12 | |||
n=3; F-tabulated=19; t-tabulated=4.3
Table 4: Determination ramipril, hydrochlorothiazide and bisoprolol in dosage form using the proposed chemometric methods compared to HPLC method
Conclusion
Three chemometric procedures have been described for the determination of the bisoprolol, hydrochlorothiazide and ramipril. The assay results obtained using the developed chemometric methods were compared to others obtained by reported HPLC method and there was no significant difference between the compared methods. The developed methods have the advantages of using zero- order spectra without the need of any other order. The developed methods are simple, economic, and need neither for separation steps nor for complicated calculations. The procedures have been applied successfully for the determination of those drugs in both synthetic mixture and dosage form Combitrust™.
References
- United States of Pharmacopoeia. 2009. United States Pharmacopoeial Convention. Rockville.
- B. Burcin, G. Mehmet, D. Burcu, B.U. Topal, A.O. Sibel, J. AOAC. Int., 2013, 96, 42-51.
- F. Belal, I.A. Al-Zaagi, E.A. Gadkariem, M.A. Abounassif, J. Pharm. Biomed. Anal., 2001, 24, 335-342.
- D. Suchitra, B.N. Nageswara Rao, A. Ravindranath, M.S. Sakunthala, V. Jayathirtha Rao, Int. J. Pharm. Pharm. Sci., 2011, 3, 185-189.
- S. Bankey, G.G. Tapadiya, S.S. Saboo, S. Bindaiya, J. Deepti, S. Khadbadi, Int. J. ChemTech. Res., 2009, 1, 183-188.
- S. Lakshmi, K.S. Lakhami, J. Anal. Pharm. Res., 2015, 4, 536-550.
- B. Shravan, B. Shailendra, P. Ritesh, IJPCR., 2012, 1, 95-103.
- S.J. Joshi, P.A. Karbhari, S.I. Bhoir, K.S. Bindu, C. Das, J. Pharm. Biomed. Anal.,2010, 52, 362-371.
- B.N. Jinesh, G.A. Preethi, Am. J. PharmTech. Res., 2014, 4, 349-365.
- S.Y. Savita, R.R. Janhavi, Int. J. Pharm. Pharm. Sci., 2013, 5, 286-290.
- S. Alahmad, H.M. Elfatatry, M.M. Mabrouk, S.F. Hammad, F.R. Mansour, Der Pharma Chemica., 2017, 9(20), 70-75.
- R. Kramer, Chemometric Techniques in Quantitative Analysis. Marcel Dekker Inc., New York, 1998.
- M.M. Otto, Chemometrics, Statistics and Computer Application in Analytical Chemistry, Wiley-VCH, Weinheim, 1997, 197.
- H.M. Elfatatry, M.M. Mabrouk, S.F. Hammad, F.R. Mansour, A.H. Kamal, S. Alahmad, JAOAC Int., 2016, 99, 1247-1251.
- S. Alahmad, H.M. Elfatatry, M.M. Mabrouk, S.F. Hammad, F.R. Mansour, CDDT., 2017, 14, 1-7.
- R. Kramer, Chemometrics TOOLBOX for use with MATLAB, The Math Works, Inc., Natick, 1995.


