Research Article - Der Pharma Chemica ( 2022) Volume 14, Issue 4
Assessment of Water Quality of Udebal Lake, Nearby Santram Mandir, Nadiad, Dist. Kheda, Gujarat, India
DK Bhoi*, Rakshit G. Patel, MB Chauhan, SB Dalicha, Arpita Shah and Nikita SharmaDK Bhoi, Department of Chemistry, J. & J. College of Science, Nadiad – 387001. Dist. Kheda, Gujarat, India, Email: bhoidipak2009@yahoo.co.in
Received: 05-Mar-2022, Manuscript No. dpc-22-56213; Editor assigned: 08-Mar-2022, Pre QC No. dpc-22-56213 (PQ); Reviewed: 22-Mar-2022, QC No. dpc-22-56213; Revised: 27-Mar-2022, Manuscript No. dpc-22-56213 (R); Published: 04-Apr-2022, DOI: 10.4172/0975-413X.14.4. 1-7
Abstract
Assessment of Water Quality of Udebal Lake near by Santram Mandir. It’s Physico Chemical analysis such as, pH, Total Alkalinity, Total Hardness, T.D.S, Calcium, Magnesium, Chloride, Nitrate, Sulphate, D.O during January 2020 to January 2022, The present study calculate the Water Quality Index of lake and assess the impact of industries, agriculture and human activities. W.Q.I has been calculated of Udebal Lake, Nearby Santram Mandir, and District: Kheda, Gujarat (India). Four different locations were selected in Udebal Lake, Nearby Santram Mandir. Total Ten Physico– Chemical parameters were monitored for the calculation of W.Q.I in Rainy, winter and summer seasons. The parameters namely pH, Total Alkalinity, Calcium, Magnesium, Chloride, Sulphate, were exceeding the permissible limits as prescribed by Indian Standards. However, The W.Q.I values in the present investigation were reported to be more than 60(68.89,113.958,138.74), Indicating that the Water Quality is poor in Rainy and Winter season and more poor in Summer season and used for drinking purpose after purification .The Pollution load is relatively lighter during Summer season which compare to the Winter and Rainy Season. Results obtained are compared in term of their highest value and lowest values among three seasons in term of 10 parameters.
Keywords
Udebal Lake; Assessment; W.Q.I; Physico– Chemical; Season; Permissible Limits
Introduction
Water is extremely elementary to light one cannot imagine a form of life that might exist water without water on the surface of the earth Water in the form of ocean, sea, glaciers freshwater bodies, river Where Lake etc. occupies about 71.00% of the area while, the landmass occupies about 29.00% of the area [1, 2]. Water is most essential for existence of life on earth and is a major component for all forms of life from micro-organism to men Various Physico-Chemical parameters has a significant role in determining the portability of Water. The use of fertilizers, pesticides and manure are main source of Water pollution in this area Water is one of the most important factor for every living organism on this planet Water is generally used for drinking fisheries and other domestic purpose in the in this area.
Therefore we carried out studies of Physico-Chemical parameters of surface water in Gujarat state whether they are fit for drinking or some other purposes of various central areas in Gujarat state [3]. The major hazard in drinking Water supplies is microbial contamination which is due to agricultural land waste, domestic sewage and industrial effluent [4] etc. On the other hand lakes also provide a habitat for invertebrates, fishes and aquatic birds. Therefore scientific study needs to review strategies for conservation and better utilization of lakes. It is with their background, Water Quality Index (W.Q.I) provides a single number that expresses overall Water quality at a certain location and time, based on several Water quality parameters [5, 6]. The objective of Water Quality Index is to turn complex Water quality data into information that is understandable and used by the public. A single number cannot tell the whole story of Water quality parameters that are not included in the index. However, a Water Quality Index based on some very important parameters can provide a single indicator of Water quality (Figure 1).

Figure 1: Studies of Physico -Chemical parameters of surface water in Gujarat state.
Methodology
Study Area
Udebal Lake is located Nearby Santram Mandir in Nadiad. Udebal Lake is located between 22.6902o latitude and 72.8949o longitude. It is situated in Nadiad and comes under Kheda district. Udebal Lake Near by Santram Mandir is an old lake.
Samples Collections
Samples of Water were collected from four sites of the lake once every month (January 2020 to January 2022). One liter P.E.T. bottles were used for collection of Water samples from a depth of 30 cm. During morning hours between 8.00 -10.00 AM. For Dissolved Oxygen measurement, a 300 ml capacity BOD bottle was used for collection of water sample and the Oxygen was fixed at the sampling site before being carried to the laboratory. The parameter pH was monitored at the sampling site and other parameters like Total Alkalinity, Total Hardness, Total Dissolved Solids, Calcium, Magnesium, Chloride, Nitrate and Sulphate were analysed in the laboratory as per the standard procedures. APHA [2005] [7, 8].
The concept of Water Quality Index was first proposed by Horton (1965). For the calculation of Water Quality Index. 10 important Physico – Chemical parameters were chosen.
W.Q.I has been calculated by using the standards of drinking water quality recommended by the World Healt h Organization (WHO) 1992 [9], Bureau of Indian Standards (BIS) - 1993 and Indian Council for Medical Research (ICMR) 1975. The weighted arithmetic index method (Brown et. al.) has been used for the calculation of W.Q.I of the lake. Further quality rating or sub index (qn) was calculated using the following expression (Tables 1-3).
| Water Quality Index | Water Quality Status |
|---|---|
| 0 – 25 | Excellent Water Quality |
| 26 – 50 | Good Water Quality |
| 51 – 75 | Poor Water Quality |
| 76 – 100 | Very Poor Water Quality |
| > 100 | Unfit for drinking |
| Parameter (Unit) | Method |
|---|---|
| pH | pH Probe |
| Total Alkalinity | Volumetric |
| Total Hardness | Volumetric |
| T.D.S. | Gravimetric |
| Calcium | Volumetric |
| Magnesium | Volumetric |
| Chloride | Volumetric |
| Nitrate | Colorimetric |
| Sulphate | Volumetric |
| D.O. | Volumetric |
| Parameter | Standards | Recommended Agency | Unit Weight |
|---|---|---|---|
| pH | 6.5 - 8.5 | ICMR / BIS | 0.2190 |
| Total Alkalinity | 120 | ICMR | 0.0155 |
| Total Hardness | 300 | ICMR / BIS | 0.0062 |
| T.D.S. | 500 | ICMR / BIS | 0.0037 |
| Calcium | 75 | ICMR / BIS | 0.025 |
| Magnesium | 30 | ICMR / BIS | 0.062 |
| Chloride | 250 | ICMR | 0.0074 |
| Nitrate | 45 | ICMR / BIS | 0.0413 |
| Sulphate | 150 | ICMR / BIS | 0.0124 |
| D.O. | 5 | ICMR / BIS | 0.723 |
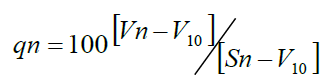
Where, qn = Quality rating for the nth water quality parameter.
Vn = Estimated value of the nth parameter at a given sampling station.
Sn = Standard permissible value of the nth parameter.
V10 = Ideal value of nth parameter in a pure water.
Ideal value in most cases V10 = 0 except in certain parameters like PH and Dissolved Oxygen. Calculation of quality rating for PH and DO is 7.0
and 14.6 mg/L respectively.
Unit weight was calculated by a value inversely proportional to the recommended standard values Sn of the corresponding parameters.
Wn = K / Sn.
Where, Wn = Unit weight for the nth parameter.
Sn = Standard value for nth parameter.
K = Constant for proportionality.
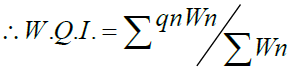
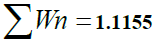
The overall Water Quality Index (W.Q.I) was calculated by aggregating the quality rating with the unit weight linearly.
Results and Discussion
The Physico-Chemical parameters of Water quality were analyzed using standard methods given in APHA, et al (2005). The values of various Physico-Chemical parameters for calculation of Water Quality Index are presented in (Table 4). While season wise Water Quality Index calculations are depicted in the (Table 5) (Table 6) (Table 7). The Water Quality Index of Rainy season, winter season and summer season are 68.59, 113.958 and 138.74 respectively. Which indicate that the Water quality is very poor to unfit for drinking used for human consumption after purification system [9]. It is also observed that the pollution load is relatively higher during summer season when compared to the winter and Rainy season. The above water quality is also supported by the following Physico Chemical parameters variations observed during the different seasons of the study.
| Parameter | Seasons | ||
|---|---|---|---|
| Rainy Season | Winter Season | Summer Season | |
| pH | 7.49 | 8.7 | 8.9 |
| Total Alkalinity | 178 | 211.2 | 521 |
| Total Hardness | 172 | 233.6 | 485 |
| T.D.S. | 446 | 800 | 977 |
| Calcium | 14 | 72 | 149 |
| Magnesium | 28 | 80 | 127 |
| Chloride | 72 | 120 | 300 |
| Nitrate | 24 | 24 | 52 |
| Sulphate | 8 | 12 | 23 |
| D.O. | 6.9 | 4 | 3 |
| Water Quality Index | 68.89 | 113.958 | 138.34 |
| Parameter | Observed Values (Vn) |
Standard Values (Sn) |
Unit Weight (Wn) |
Quality Rating (Qn) |
WnQn |
|---|---|---|---|---|---|
| pH | 7.49 | 6.5 - 8.5 | 0.2190 | 32.66 | 7.15254 |
| Total Alkalinity | 178 | 120 | 0.0155 | 148.333 | 2.2991 |
| Total Hardness | 172 | 300 | 0.0062 | 57.333 | 0.3554 |
| T.D.S. | 446 | 500 | 0.0037 | 89.2 | 0.33 |
| Calcium | 14 | 75 | 0.025 | 18.666 | 0.46665 |
| Magnesium | 28 | 30 | 0.062 | 93.33 | 5.7864 |
| Chloride | 72 | 250 | 0.0074 | 288 | 0.21312 |
| Nitrate | 24 | 45 | 0.0413 | 53.33 | 2.2025 |
| Sulphate | 8 | 150 | 0.0124 | 5.333 | 0.06612 |
| D.O. | 6.9 | 5 | 0.723 | 80.20 | 57.98 |
|
 |
 |
|||
Water Quality Index  |
|||||
| Parameter | Observed Values (Vn) |
Standard Values (Sn) |
Unit Weight (Wn) |
Quality Rating (Qn) |
WnQn |
|---|---|---|---|---|---|
| PH | 8.7 | 6.5 - 8.5 | 0.2190 | 100 | 21.9 |
| Total Alkalinity | 211.2 | 120 | 0.0155 | 176 | 2.728 |
| Total Hardness | 233.6 | 300 | 0.0062 | 77.866 | 0.4827 |
| T.D.S. | 800 | 500 | 0.0037 | 160 | 0.592 |
| Calcium | 72 | 75 | 0.025 | 96 | 2.4 |
| Magnesium | 80 | 30 | 0.062 | 266.66 | 16.53 |
| Chloride | 120 | 250 | 0.0074 | 48 | 0.3552 |
| Nitrate | 24 | 45 | 0.0413 | 53.33 | 2.2025 |
| Sulphate | 12 | 150 | 0.0124 | 8 | 0.0992 |
| D.O. | 4 | 5 | 0.723 | 110.4166 | 79.8312 |
 1.1155 1.1155 |
 |
 =127.1208 =127.1208 |
|||
Water Quality Index  |
|||||
| Parameter | Observed Values (Vn) |
Standard Values (Sn) |
Unit Weight (Wn) |
Quality Rating (Qn) |
Wn/ Qn |
|---|---|---|---|---|---|
| PH | 8.9 | 6.5 - 8.5 | 0.2190 | 100 | 21.9 |
| Total Alkalinity | 521 | 120 | 0.0155 | 434.16 | 6.7294 |
| Total Hardness | 485 | 300 | 0.0062 | 161.66 | 1.0022 |
| T.D.S. | 977 | 500 | 0.0037 | 195.4 | 0.7229 |
| Calcium | 149 | 75 | 0.025 | 198.66 | 4.966 |
| Magnesium | 127 | 30 | 0.062 | 423.33 | 26.24 |
| Chloride | 300 | 250 | 0.0074 | 120 | 0.888 |
| Nitrate | 52 | 45 | 0.0413 | 115.55 | 4.7722 |
| Sulphate | 23 | 150 | 0.0124 | 15.33 | 0.19 |
| D.O. | 3 | 5 | 0.723 | 120.83 | 87.36 |
 1.1155 1.1155 |
 = 1884.92 = 1884.92 |
=154.7707 |
|||
Water Quality Index =  = 154.7707 /1.1155 138.74 = 154.7707 /1.1155 138.74 |
|||||
PH
PH is a measurement of the acidic or basic Quality of water [10,11]. The average pH values of the lake water was 7.49 mg/L during rainy season, 8.7 mg/L during winter season and 8.9 mg/L during summer season. The PH of water was relatively high in the summer season and low in Rainy and winter season. However, when the average values for three seasons are taken into account that the water body was slightly alkaline [12]. Swaranalatha and Narasingrao [1993][13]. The PH values of water samples of present study ranged from 7.49 to 8.9 of Udebal Lake Near by Santram Mandir. These values are within the prescribed limit of standards (WHO-2002).
Total Alkalinity
Alkalinity value greater than 178 mg/L is desirable for domestic use APHA (2005). The observed average value of total alkalinity was 178 mg/L during Rainy season, 211.2mg/L during winter season and 521mg/L during summer season. Total alkalinity values in our observations indicated that the water was hard. Higher values of alkalinity registered during summer season, lower during winter and Rainy season. D. K. Bhoi et. al. (2011) also reported similar findings in the study of Pariyej Lake [14].
Total Hardness
The observed average Total Hardness value was 172 mg/L during rainy season, 233.6 mg/L during winter season and 485 mg/L during summer can be attributed to low water level and high rate of evaporation of water and addition of Calcium and Magnesium salt. Mohanta and Patra (2000) stated that addition of sewage, detergents and large scale human use might be the cause of elevation of hardness [15, 16]. Udebal Lake, Nearby Santram Mandir water was moderately hard but the hardness values were up to permissible limits. Hardness below 300 mg/L is considered potable but beyond this limit produces gastrointestinal irritation (ICMR 1975).
Total Dissolved Solids
The total Dissolved solids in water of Udebal Lake was 446 mg/L. during rainy season, 800 mg/L. during winter season and 977 mg/L. during Summer season. Gupta and Singh (2000) also reported high concentration of TDS in the Damodar River due to mixing of sewage and industrial water. Gray N. F. (2005) reported that the hardness in the water is due to the Dissolved minerals from sedimentary rocks, seepage and run-off. Detergents and soaps also aggravate the situation [17, 18].
Calcium
The observed average value of Calcium was 14 mg/L during rainy season, 72 mg/L during winter season and 149 mg/L during summer season. The quantities of Calcium in natural water depend upon the type of rocks. Small concentration of Calcium is reducing corrosion in water pipes [19].
Magnesium
The observed average value of Magnesium was 28 mg/L during Rainy season, 80 mg/L during winter season and 127 mg/L during summer season. The values of Magnesium Winter, summer season were not in permissible limits, Magnesium hardness particularly associated with the Sulphate ion has laxative effect on persons unaccustomed to it. (Khursid 1998)-. The recorded increase in Ca and Mg concentration during pre-monsoon may be the effect of bacterial decomposition. Jaybhaye and Madlapure (2005) reported high values of Calcium and Magnesium in Parola dam, Dist. Hingoli, Maharashtra.
Chloride
Chloride occurs in all types of natural waters. The high concentration of Chloride is considered to be an indication of pollution due to high organic waste of animal origin (Singh, 1995). The observed Chloride value was 72 mg/L during rainy season, 120 mg/L during winter season and 300 mg/L in summer season. The higher values of Chloride recorded in summer season. Similar results were also reported by from Pariyej lake, Kheda district, Gujarat. The high values may be attributed to low water levels during summer season [20].
Nitrate
The Nitrate ranged from 24 mg/L during rainy season, 24 mg/L during winter season and 52 mg/L during summer season during. In present study water sample of rainy and winter showed low concentration of Nitrate well below permissible levels in Rainy, Winter but higher in summer as per the standards. According to Jhingram and Sugunan (1990) the water with the 0.2 to 0.5 ppm of Nitrate is of high productive reservoirs, upto 0.2 ppm Nitrate is medium productive reservoirs and in low productive reservoirs, the Nitrates are negligible. According to the above classification present reservoir belongs to high productive nature.
Sulphate
Sulphate ion does not affect the taste of water if present in low concentration. The observed average value of Sulphate was 8 mg/L during rainy season, 12 mg/L during winter season and 23 mg/L during summer season. The Sulphate value in Udebal Lake water was found within the acceptable limit of 150 mg/L.
Dissolved Oxygen (D.O)
Dissolved Oxygen (D.O.) is important to the health of aquatic ecosystem because all aquatic organisms need Oxygen to survive. The average Dissolved Oxygen (D.O.) was 6.9 mg/L during rainy season, 4 mg/L during winter season and 3 mg/L during summer season. The maximum Dissolved Oxygen in the water of Udebal Lake was recorded in rainy season. Thereafter it started declining gradually and in summer reached the lowest concentration. The maximum DO in rainy season may be due to low atmospheric temperature and minimum D.O. was recorded in Summer season may be due to high metabolic rate of organism similar result was also reported [16] [20] .
Conclusions
The W.Q.I. values in the present investigation of Udebal Lake in rainy season, winter season and summer season are 68.89, 113.958 and 138.74 respectively. Which indicate that the water quality is poor to unfit for drinking.
Acknowledgment
The authors with to express their gratitude to Nadiad Education Society for laboratory facilities. For analytical work Central Salt and Marine Chemical Research Institute, (CSMCRI) Bhavnagar. The authors are thankful to the UGC for financial assistance in the form of Minor Research Project.
REFERENCES
- American Public Health Association. New York. 1985.
- Bhagat PR. Rasayan J Chem. 2008, 1(1): pp.195-197.
- Bhoi DK, Raj DS, Mehta YM et al., Oriental J Chem. 2004, 20(2): 361-364
- WHO. World Health Organization, Geneva, Switzerland. 2005.
- Rakshit P, Bhoi DK, Thakor FJ et al, Proceedings on International E-conference on advances in chemical Sciences and pharmaceutical Chemistry. 2022, 3: 10-18.
- Horton RK. J Water Pollut Control Fed. 1965, 37(3): pp.300-306.
- ICMR. Indian Council of Medical Research. 1975, pp.27-28.
- Chatterjee C and Raziuddin M. Nat Environ Pollut Technol. 2002, 1(2): pp.181-189.
- BIS. Bureau of Indian Standards, New Delhi. 1993.
- WHO. Water sanitation health. 2007.
- WHO, World Health Organisation Staff. World Health Organization. 2004.
- Swarnalatha N and Narasingrao A. Indian J Microbial Ecol. 1993, 3: pp.41-48.
- Singh JP and Roy SP. Environ Ecol. 1995, 13(2): pp.330-335.
- Jhingran AG and Sugunan VV. In Proceedings of the national workshop on reservoir fish. 1990: pp. 1-8.
- Munawar M. Hydrobiologia. 1970, 35(1): pp.127-127.
- Khursid S, Zaheeruddin and Basheer A. Ind J Env Prot. 1998, 18(4): pp.246-249.
- Gray NF. Water Tech p. 2000.
- Thakor FJ, Bhoi DK, Dabhi HR et al., Curr World Environ. 2011, 6(2): p.225.
- Bhoi DK, Raj DS, Mehta YM et al., Asian J Chem. 2005, 17(1): p.404.
- Ahluwalia VK and Mishra A. Ane Books Pvt Ltd. 2007. Google Scholar
Indexed at, Google Scholar , Crossref
Indexed at, Google Scholar , Crossref


