Research Article - Der Pharma Chemica ( 2018) Volume 10, Issue 2
Analytical Application of Different Spectrophotometric Methods for Simultaneous Determination of Norfloxacin and Tinidazole in their Pure Forms and their Pharmaceutical Preparation
Maya Shaaban Eissa1, Eman Darweish1*, Mohammed Refaat Elghobashy2, Mostafa Abdelaty Shehata21Analytical Chemistry Department, Faculty of Pharmacy, Egyptian Russian University, Badr City, Cairo, Egypt
2Analytical Chemistry Department, Faculty of Pharmacy, Cairo University, Kasr El-Aini Street, Cairo, Egypt
- *Corresponding Author:
- Eman Darweish
Analytical Chemistry Department
Faculty of Pharmacy, Egyptian Russian University
Badr City, Cairo, Egypt
Abstract
Smart spectrophotometric methods were introduced for the simultaneous determination of Norfloxacin (NF) and Tinidazole (TZ) in pure forms and their tablet pharmaceutical formulation. The proposed methods under study are. Ratio Difference (RD) in which the amplitude difference at 273 and 306 nm for the determination of NF and TZ was measured. Mean Centering of Ratio spectra (MCR) in which the peak amplitude at 270 nm for the determination of NF and summation of the peak amplitudes at 270 and 304 nm for the estimation of TZ were measured. Dual Wavelength (DWL) in this method, wavelengths 210 and 287 nm were used for NF determination, 270 and 287 nm for TZ determination. Bivariate method (BIV) in which two wavelengths 280 and 305 nm for quantitative estimation of NF and TZ were used. All of the previous methods determined successfully NF and TZ in concentration ranges of 1-12 μg/ml and 3-30 μg/ml, respectively. Chemo metric assisted method Partial Least-Squares (PLS). All of the developed methods were validated using International Conference on Hormonization (ICH) guidelines and statistically compared to High Performance Liquid Chromatography (HPLC) reported method. The adopted methods can be applied for the regular analysis of NF and TZ mixture in QC laboratories.
Keywords
Norfloxacin, Tinidazole, Ratio difference, Dual wavelength, Mean centering, Bivariate, PLS
Introduction
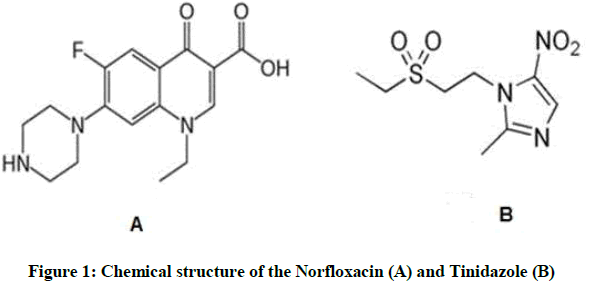
Norfloxacin (NF), [1-ethyl-6-fluoro-1, 4-dihydro-4-oxo-7-(piperazin-1-yl) quinoline-3 carboxylic acid], is a fluoroquinolone carboxylic acid derivative [1] which is used as broad spectrum antibacterial (Figure 1A). The mode of action of NF includes the inhibition of bacterial gyrase, the enzyme which is involved in DNA recombination, replication and repair. NF stops growth of the bacterial cell by restrict gyrase enzyme leading to stop the affinity to metal ions by quinolones which are vital cause of their antibacterial activity. Tinidazole (TZ), [1-(2-(ethyl sulfonyl) ethyl)-2-methyl-5-nitroimidazole], is an effective antibacterial and antiprotozoal agent [1] (Figure 1B). Tinidazole is an effective agent for treatment of giardiasis, amoebiasis, trichomonas's and amebic liver abscess. The mixture of NF and TZ is present in market in tablet formulation to treat gastrointestinal infections caused by amoebic infection or bacterial prostatitis, and urinary tract infections. Literature survey showed that there are number of methods which had been reported for determination of NF and TZ together for example, electrochemical analysis [2] capillary electrophoresis [3], spectrophotometry [2,4-7], High Performance Liquid Chromatography (HPLC) [8,9]. In the present work, different univariate and multivariate spectrophotometric methods are proposed for simultaneous determination of NF and TZ without previously separation in their pure forms and in pharmaceutical dosage form without any interference from each other.
Experimental Section
Materials and reagents
(a) Pure sample: Norfloxacin (certified to contain 99.5%) was kindly supplied by Egyptian International Pharmaceutical Industries Company (EIPICO). Tinidazole (Certified to contain 99.78%) was kindly supplied by Medical Union Pharmaceuticals, Cairo, Egypt; (b) Pharmaceutical Preparation: CONAZ® tablets batch number 130460A manufactured by Pharaonia Pharmaceuticals for Wockhardt, Egypt contain 400 mg NF and 600 mg TZ per tablet, were obtained from the local pharmacy; (c) Methanol (Piochem®) spectroscopic grade and distilled water.
Instruments
JASCO dual beam (Japan) UV-visible spectrophotometer model V-630.
Software
The bundle software, spectra manager II was used. The spectral slit width was 2 nm and scans speeds 1000 nm/min. Mean centering was done with a written code in Matlab7.10.0.499 (R2010a).
Standard solutions
Preparation of standard solutions
• NF standard stock solutions: 100 μg/ml in methanol
• TZ standard stock solutions: 100 μg/ml in methanol
Procedure
Standard serial dilutions of both NF and TZ in the range of 1-12 μg/ml and 3-30 μg/ml respectively, were prepared separately from their standard stock solutions using methanol as a solvent, then the zero order of absorption spectra were recorded after scanning them at 200-400 nm by using methanol as blank, stored in the computer.
Construction of calibration curves
Univariate and bivariate spectra
Ratio Difference Method (RD): The stored zero order spectrums for each concentration of NF was divided by 3 μg/ml of TZ as divisor and for each concentration of TZ was divided by 2 μg/ml of NF as divisor. The ratio spectra were obtained as mentioned previously were used to develop RD calibration curves for NF and TZ by plotting the amplitude difference of ratio spectra at 273 and 306 nm for NF and at 273 and 306 nm for TZ against their corresponding concentrations in μg/ml and the regression equations were then computed.
Mean Centering (MC): The ratio spectra mentioned previously in the range of 200-400 nm were mean centered, then the calibration curves were constructed by plotting the peak amplitude at 270 nm to the corresponding concentration of NF and the Sum of peak amplitude at 270 and 304 nm for TZ.
Dual Wavelength Method (DWL): The absorption spectra of NF and TZ were applied to develop DWL in which absorbance difference were measured at 280-210 nm for NF and 287-270 nm for TZ. The calibration curves were established according to the relation between these differences in absorption at the selected wavelengths and the concentrations of the 2 drugs.
Bivariate: The zero order absorption spectra of the prepared corresponding concentrations were measured at 280, 285, 290, 295, 300 and 305 nm for selection of two wave lengths to develop four linear calibration; curves; each component had 2 calibrations at 2 wavelengths which were selected using Kaiser method at 280 and 305 nm and the corresponding regression equations were then calculated.
Application to laboratory prepared mixtures
Using a series of 10 ml volumetric flasks, accurate aliquots of NF and TZ were transferred from standard solutions to prepare mixtures with different ratios of the two drugs then; the volume was completed with methanol. The spectra of the prepared mixture were recorded and the concentrations of NF and TZ were calculated using the corresponding regression equations for each method.
Multivariate chemometric models
Standard stock solutions were prepared as discussed before in section 2.4. For development of calibration and validation sets multilevel multifactor design was established [10]. The calibration design which established, was five-level, five-factor. The concentrations details are illustrated in Table 1.
| Sample number | NF | TZ |
|---|---|---|
| 1 | 6 | 15 |
| 2 | 6 | 9 |
| 3 | 2 | 9 |
| 4 | 2 | 21 |
| 5 | 10 | 12 |
| 6 | 4 | 21 |
| 7 | 10 | 15 |
| 8a | 6 | 12 |
| 9a | 4 | 12 |
| 10a | 4 | 18 |
| 11 | 8 | 21 |
| 12 | 10 | 18 |
| 13a | 8 | 15 |
| 14 | 6 | 21 |
| 15 | 10 | 21 |
| 16 | 10 | 9 |
| 17 | 2 | 18 |
| 18 | 8 | 9 |
| 19 | 2 | 15 |
| 20a | 6 | 18 |
| 21a | 8 | 18 |
| 22a | 8 | 12 |
| 23 | 4 | 9 |
| 24 | 2 | 12 |
| 25a | 4 | 15 |
Table 1: Concentrations of NF and TZ in the calibration and validation sets for PLS.
PLS model
To build calibration models, mixtures of seventeen laboratory-prepared mixtures of NF and TZ were prepared by taking portion of the standard solution in a 10 ml volumetric flask and methanol was used to complete the volume. The prepared mixtures were scanned at 200-400 nm using methanol as blank then; absorption spectra were stored on computer. After this step, the data were transferred to MATLABs 7.10 for following data analysis and to construct calibration model for PLS. For external validation assay, different ratios of eight laboratory corresponding prepared mixture of NF and TZ were scanned at 200-400 and the absorption spectra were recorded in order to calculate concentration of NF and TZ in the prepared mixture, the optimized calibration model of PLS was used.
Application to pharmaceutical preparation
To determine the concentrations of NF and TZ in their pharmaceutical preparation for each of the developed method, 10 tablets were weighed and very finely powdered (Each tablet contain 400 mg NF and 600 mg TZ). A portion of accurately weighed powdered equivalent to one tablet was transferred to 100 ml volumetric flask. 75 ml of methanol was added and stirred using a magnetic stirrer for 35 min. The volume was then completed to 100 ml with methanol. Then, filtration was performed using 0.5 μm Whatman filter paper. The required dilutions for each of the adopted method were prepared of the filtrate with the same solvent to get different concentrations of NF and TZ in their linearity ranges. The determinations were in triplicate for each concentration. To appraise the accuracy of the proposed methods, standard addition technique was applied.
Results and Discussion
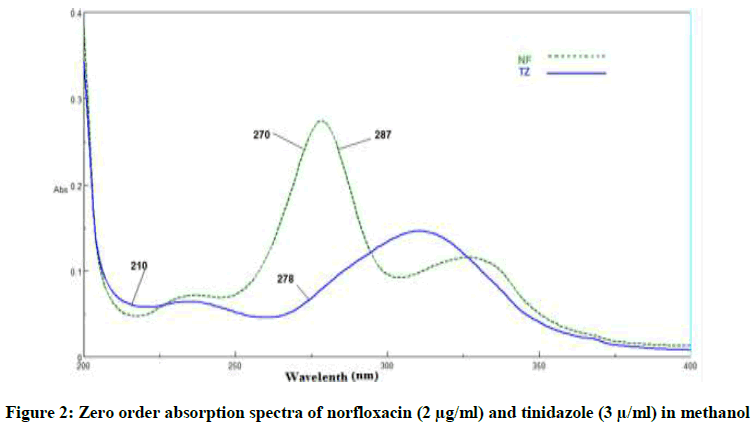
The developed methods were applied to resolve the spectral overlap of NF and TZ in their binary mixture, as shown in Figure 2, without previous separation steps.
Method development and optimization
Univariate and bivariate methods
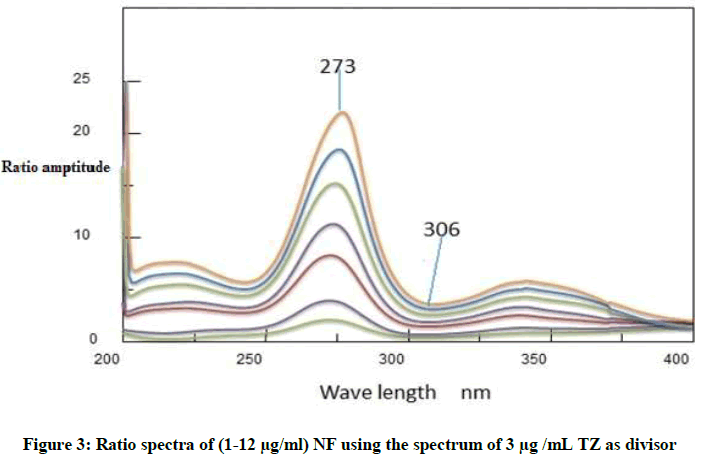
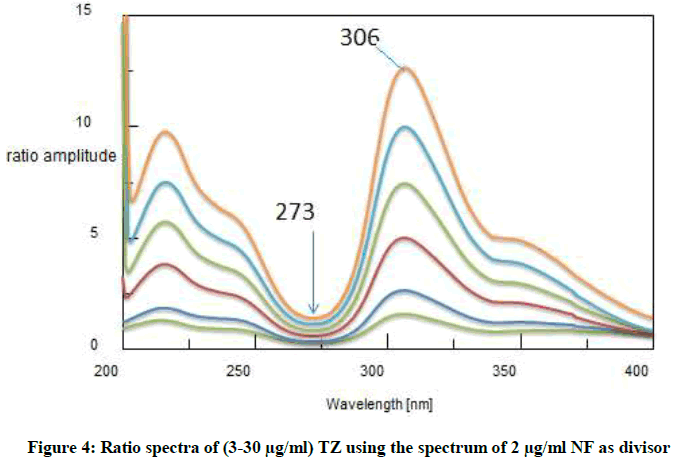
Ratio difference method: This method is simple, accurate include two essential steps; first one is to select appropriate divisor. After trying different divisors, the best results in according to accuracy and precision showed that the divisor of choice was 2 μg/ml of NF and 3 μg/m of TZ. The absorption spectra of each drug were divided by the chosen divisor. The second important step is how to choose the most suitable wavelengths at which our measurements will be recorded [11]. The selected wavelengths, in the ratio spectra should have distinct difference in amplitudes as shown in Figures 3 and 4. In order to reveal a good linearity, many pairs of wavelengths were tested, and according to this, wave lengths 273 and 306 nm for NF, and wave lengths of 273 and 306 nm were selected for TZ. Their linear regression equations were then computed.
ΔP NF=1.5168C-0.3244 r=0.9999
ΔP TZ=0.0.3244C-0.0212 r=0.9998
Where, ΔP express the difference of peak amplitude of the ratio difference spectrum curve, C is concentration of drug in μg/ml and r is the correlation coefficient.
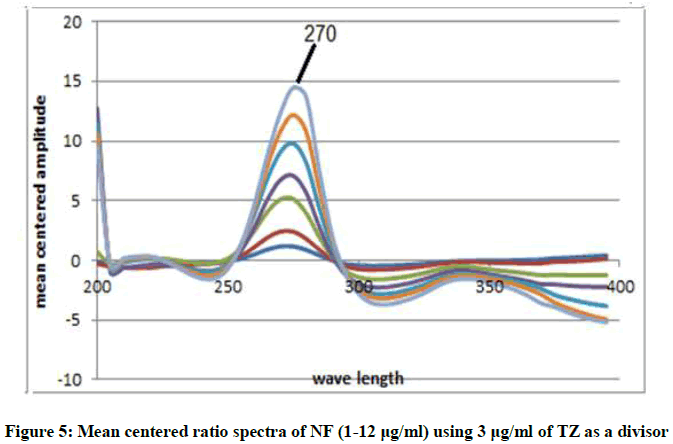
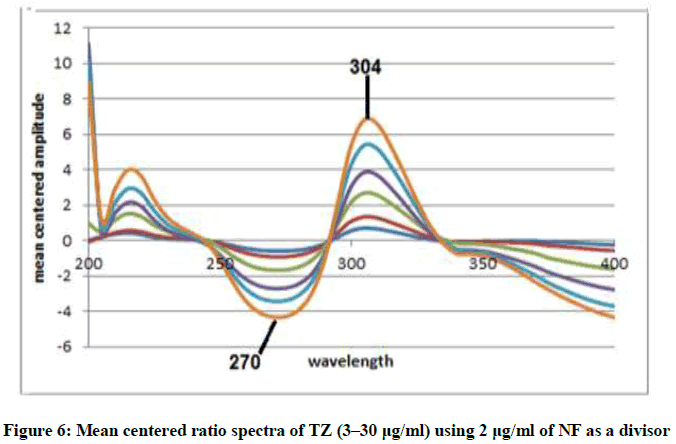
Mean Centering Method (MCR): This method is of a great advantage in that; it can minimize noise in ratio spectra and enhance sensitivity. This is due to mean centering of the ratio spectra [12,13] in the range of 200-400 nm as in Figures 5 and 6 after using the appropriate divisor to each drug as previously discussed under RD method. The concentrations of NF and TZ can be determined without prior separation at 270 nm for NF nm and the sum of 270 and 304 nm for TZ. Regression equations were then computed.
MCRNF=1.1488C+0.5614 r=0.9999
MCRTZ=0.3684C-0.0.0124 r=0.9997
Where, MCR represents the peak amplitude of the mean centered ratio spectrum curve, C express concentration and r express the correlation coefficient.
DWL method: Simple and effective method for the determination of the two drugs without previous separation in which the effect of one drug was eliminated to measure the second one. This can be done by selecting two wavelengths which record zero in absorbance difference for the first drug and the same two wavelengths have obvious absorbance difference value for the second drug [14] as shown in Figure 2. For determination of NF the absorbance difference at 210 and 278 nm was measured at which these wave lengths have absorbance difference zero for TZ, while for TZ the absorbance difference at 270 and 287 nm was measured at which absorbance difference was zero in NF. The regression equations were then calculated.
ANF =0.0933C+0.0065 r =0.9997
ATZ = 0.0127C+0.0101 r=0.9995
In which, A express the absorbance difference, C is concentration in μg/ml and r is correlation coefficient.
Bivariate method
For application of this method, simple mathematical algorithm was used at which four regression equations were constructed, two calibrations for every component at two chosen wavelengths by applying Kaiser method [15]. Absorbance at the chosen wavelengths was measured and corresponding regression equations were calculated for NF and TZ.


Where, CA, CB are concentrations of the analytes, AAB1, AAB2 are the absorbance of the drug mixture at the two selected wavelengths (1 and 2), respectively, eAB1, eAB2 are the sum of intercepts of the linear calibration at two wavelengths (eAB1=eA1+eB1) and mA1,2, mB1,2 are the slopes of the linear regression. For NF and TZ mixture, six wavelengths 280, 285, 290, 295, 300 and 305 nm were selected and Kaiser Method was applied to choose two wavelengths at which four regression equations from two calibrations for every component were obtained. The chosen wavelengths are 280.0 and 305.0 nm. At these chosen wavelengths, the one-component calibration curves were constructed in the range of 1-12 μg/ml for NF and 3-30 μg/ml for TZ. The equations of linear regression were:
A280=0.1455 C - 0.0142 r=0.9996 at 280 nm for NF
A305 =0.0433 C+ 0.0138 r=0.9995 at 285 nm for NF
A280=0.0158C+0.0169 r=0.9997 at 280 nm for TZ; A305=0.0376C+0.0157 r=0.9996 at 285 nm for TZ.
Where, A represent absorbance value at 280 nm and 305 nm, C represent concentration in μg/ml and r represent correlation coefficient.
Validation of the methods
The developed methods were validated according to ICH recommendations [16].
Linearity and range: Methods linearity could be estimated by analyzing seven concentrations of NF ranging from 1-12 μg/ml and six concentrations of TZ ranging from 3-30 μg/ml.
Accuracy: The accuracy of the developed methods was evaluated by applying five different concentrations of every drug with in linear range in which good percentage recoveries for the developed methods was found as mentioned in Tables 2 and 3. The accuracy of the adopted methods was checked by applying standard addition technique, where satisfactory results were obtained Table 4.
| Parameter | RD | MCR | DWL | BIV | ||||||||||
|---|---|---|---|---|---|---|---|---|---|---|---|---|---|---|
| NF | TZ | NF | TZ | NF | TZ | NF | TZ | |||||||
| wavelength selected (nm) | ∆P 273-306 |
∆P 273-306 |
P 270 |
P 270+304 |
∆P 210-278 |
∆P 270-287 |
280 | 305 | 280 | 305 | ||||
| Accuracya (Mean ± RSD) |
99.71 ± 1.518 |
100.01 ± 1.63 |
99.76 ± 1.026 |
100.63 ± 1.511 |
100.35 ± 1.019 |
99.44 ± 0.887 | 99.53 ± 1.221 | 99.97 ± 1.001 | ||||||
| Precision | ||||||||||||||
| Repeatability (RSD)b | 1.329 | 1.196 | 0.960 | 1.560 | 0.931 | 1.015 | 1.181 | 1.008 | ||||||
| Intermediate precision (RSD)c | 1.098 | 1.355 | 0.847 | 1.277 | 0.958 | 0.218 | 0.916 | 1.311 | ||||||
| Linearity | ||||||||||||||
| Correlation coefficient | 0.9999 | 0.9998 | 0.9997 | 0.9999 | 0.9997 | 0.9995 | 0.9996 | 0.9995 | 0.9997 | 0.9996 | ||||
| Slope | 1.5168 | 0.376 | 1.1488 | 0.3684 | 0.0933 | 0.0127 | 0.1455 | 0.0433 | 0.0158 | 0.0376 | ||||
| Intercept | 0.3244 | -0.0212 | 0.5614 | -0.0124 | 0.0065 | 0.0101 | -0.0142 | 0.0138 | 0.0169 | 0.0157 | ||||
| LOD (µg/ml) | 0.14 | 0.74 | 0.27 | 0.44 | 0.27 | 0.96 | 0.28 | 0.32 | 0.75 | 0.85 | ||||
| LOQ (µg/ml) | 0.42 | 2.23 | 0.82 | 1.33 | 0.83 | 2.91 | 0.86 | 0.97 | 2.28 | 2.57 | ||||
Table 2: Regression parameters and results of determination of pure samples of NF and TZ by the developed methods.
| NF | TZ | RD | MCR | DWL | BIV | |||||
|---|---|---|---|---|---|---|---|---|---|---|
| Recovery % | Recovery % | Recovery % | Recovery % | |||||||
| Concentration (μg/ml) | NF | TZ | NF | TZ | NF | TZ | NF | TZ | ||
| 2 | 3 | 99.44 | 101.51 | 98.34 | 100.83 | 99.83 | 100.61 | 99.38 | 101.08 | |
| 2 | 6 | 99.83 | 100.52 | 99.17 | 98.58 | 101.87 | 98.50 | 100.62 | 99.81 | |
| 4 | 3 | 98.46 | 100.98 | 101.75 | 101.16 | 100.52 | 102.14 | 102.03 | 101.08 | |
| 4 | 6 | 101.88 | 101.50 | 99.27 | 101.81 | 99.69 | 101.94 | 101.38 | 100.72 | |
| 4 | 12 | 100.68 | 98.34 | 101.34 | 100.15 | 98.49 | 100.77 | 101.70 | 98.09 | |
| 6 | 6 | 101.04 | 101.90 | 100.23 | 102.09 | 99.05 | 99.24 | 98.05 | 98.32 | |
| Mean | 100.22 | 100.79 | 100.02 | 100.77 | 99.91 | 100.53 | 100.53 | 99.85 | ||
| SD | 1.225 | 1.296 | 1.331 | 1.277 | 1.185 | 1.445 | 1.538 | 1.359 | ||
| RSD | 1.222 | 1.286 | 1.331 | 1.267 | 1.186 | 1.437 | 1.53 | 1.361 | ||
Table 3: Determination of the studied drugs in the laboratory prepared mixtures
| Pharmaceutical preparation (Recovery % ± SD)* | Standard addition (Recovery % ± SD)** | |||
|---|---|---|---|---|
| NF | TZ | NF | TZ | |
| Ratio difference | 100.3 ± 1.299 | 99.12 ± 1.454 | 100.3 ± 1.303 | 99.12 ± 1.441 |
| Mean centering | 100.97 ± 1.201 | 100.99 ± 0.992 | 99.92 ± 1.578 | 100.92 ± 0.567 |
| Dual wavelength | 100.83 ± 1.023 | 99.12 ± 0.757 | 99.95 ± 0.917 | 99.25 ± 0.456 |
| Bivariate | 99.95 ± 0.987 | 100.44 ± 1.235 | 99.8 ± 0.45 | 99.17 ± 0.851 |
| PLS | 99.66 ± 0.922 | 100.23 ± 0.644 | 100.46 ± 638 | 99.7 7± 1.185 |
Table 4: Determination of NF and TZ in CONAZ tablet by the developed methods and application of standard addition technique
Specificity: The specificity of the developed methods evaluated by analysis of laboratory prepared mixtures of NF and TZ in different ratios whose concentration were inside the linear range. Satisfactory results were obtained as illustrated in Table 3.
Precision: Precision of the developed methods was estimated by applying intra-day and inter-day precision in triplicate using 3 different concentrations of NF and TZ either on the same day or on three different days then the relative standard deviations were calculated as presented in Table 2.
Limit of Detection (LOD) and Limit of Quantification (LOQ): The LOD and LOQ of the developed methods were calculated using standard deviation (σ) of the response and the slope of the calibration curve (S) as shown in the following Equations:
LOD=3.3 × σ/S
LOQ=10 × σ/S
And their results were shown in Table 2.
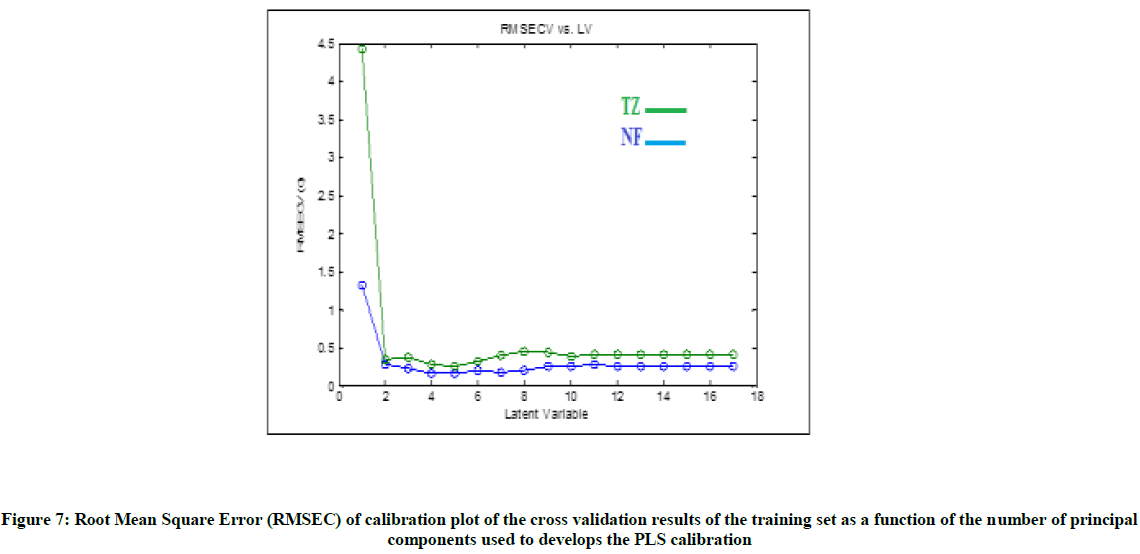
Multivariate PLS method: The required spectral data was taken with 0.1 nm interval, which produces 1001 data point for every spectrum. These results in having spectral matrix data of 17 rows, which represent different ratios of samples and 1001 columns, represent wavelengths (17 × 1001). PLS models was built by mean centering the initial data of the samples of calibration set and after this step the cross-validation method was constructed using ‘random subsets [17] each subset contains six and iterated four times for PLS. In order to develop the best correct quantitation in PLS calibrations, the appropriate factors number should be chosen for model building.
The appropriate latent variables number was reported as reported in Haal and Thomas criteria [18], the best chosen model with the least factors number was in which the error of root mean square of this calibration model was not significantly higher than the error of root mean square of calibration model which had additional factors. The most appropriate number of latent variables which represented by the constructed models was found to be four factors as in Figure 7. To evaluate the predictive ability for every constructed model, external set was applied to calculate mean of recoveries and RMSEP as presented in Table 5. The constructed PLS was validated using many diagnostic tools, from the data presented in Table 6 slope was found to be around one and intercept was found to be near to zero. The two model show high successive ability for prediction. The adopted method was applicable and valid for the analysis of NF and TZ in CONAZ® tablet. As shown in Table 4, the validity of the developed method is then assessed by applying the standard addition technique. The results were shown in Table 4.
| Sample no. | Conc. (µg/ml) | Conc. (µg/ml) | Recovery (%)* | |
|---|---|---|---|---|
| PLS | ||||
| NF | TZ | |||
| 1 | 4 | 18 | 98.35 | 99.48 |
| 2 | 6 | 18 | 101.06 | 100.96 |
| 3 | 8 | 18 | 101.31 | 100.55 |
| 4 | 8 | 15 | 100.23 | 100.51 |
| 5 | 8 | 12 | 100.98 | 100.93 |
| 6 | 6 | 12 | 99.76 | 99.59 |
| 7 | 4 | 12 | 101.87 | 99.32 |
| 8 | 4 | 15 | 98.61 | 99.81 |
| Mean | 100.27 | 100.14 | ||
| RMESP | 0.066 | 0.098 | ||
Table 5: Percentage recoveries of NF and TZ in the validation set using PLS model.
| Validation parameters | PLS | |
|---|---|---|
| NF | TZ | |
| Correlation | 0.9996 | 0.9994 |
| Slope | 1.0207 | 1.0109 |
| SE of slope | 0.0722 | 0.2148 |
| Intercept | -0.0985 | -0.1381 |
| SE of intercept | 0.0116 | 0.0141 |
Table 6: Results obtained by applying the diagnostic tools for model validation of PLS chemometric method.
Application of the methods in assay of tablet
The adopted methods were applicable for the analysis of NF and TZ in their combined pharmaceutical formulation CONAZ® tablet with no interference from the excipients; the results were shown in tables.
Statistical analysis
The results obtained from statistical comparison between the developed methods and the reported HPLC method [9] show no significant differences as presented in Table 7.
| NF | ||||||
|---|---|---|---|---|---|---|
| Parameter | RD | MCR | DWL | BIV | PLS | Reported methodc [9] |
| Mean%a | 100.30 | 100.97 | 100.43 | 99.95 | 99.66 | 100.87 |
| SD | 1.299 | 1.201 | 1.023 | 0.917 | 0.922 | 1.081 |
| Variance | 1.687 | 1.442 | 1.047 | 0.841 | 0.85 | 1.169 |
| t-test (2.23)b | 0.83 | 0.15 | 0.72 | 1.59 | 2.08 | |
| F (5.05)b | 1.44 | 1.23 | 1.12 | 1.39 | 1.38 | |
| TZ | ||||||
| Parameter | RD | MCR | DWL | BIV | PLS | Reported methodc [9] |
| Mean%a | 99.12 | 100.99 | 99.73 | 100.44 | 100.23 | 100.54 |
| SD | 1.454 | 0.992 | 0.757 | 1.235 | 0.664 | 0.876 |
| Variance | 2.114 | 0.984 | 0.573 | 1.525 | 0.441 | 0.767 |
| t-test (2.23)b | 2.04 | 0.83 | 1.71 | 0.16 | 0.69 | |
| F (5.05)b | 2.76 | 1.28 | 1.34 | 1.99 | 1.74 | |
Table 7: Statistical analysis of the adopted methods and the reported method of NF and TZ in their pharmaceutical dosage forms
Conclusion
The developed methods were concerned for simultaneous determination of NF and TZ in the pure form or in its pharmaceutical preparation. The adopted UV spectrophotometric and chemometric assisted method were considered to be simple, specific, convenient, economic, time saving. The suggested method showed high sensitivity, specificity as it can determine NF and TZ without any interference of additives and excipients. Also these adopted methods were inexpensive and simple without any sophisticated instruments or techniques. The adopted methods can be easily applied in quality control laboratories without preliminary separation.
References
- National Formulary XXII. Maryland: Rockville, USP Convention Inc., The United States Pharmacopoeia XXVII. Electronic Version., 2007.
- O.Y. Razak, F.A. Belal, S.F. Abdel, D.A. Gawad, Bull. Fac. Pharm. Cairo Univ., 2004, 42, 371-382.
- A. Alnajjar, H.H. AbuSeada, A.M. Idris, Talanta., 2007, 72(2), 842-846.
- A. Shinde, H. Jadhav, S. Ingole, V.H. Kakade, Int. J. Pharm. Biomed. Res., 2012, 3(2), 90-93.
- A.E.M.I. Mohamed, O.H. Abdelmageed, I.H. Refaat, J. AOAC Int., 2007, 90(1), 128-141.
- R. Maheshwari, R.P. Bhatt, Asian J. Chem., 2006, 18(2), 1481.
- N.H.E.S. Abou-Taleb, D.T. El-Wasseef, D.R. El-Enin, M.A. Abu El-Ashry, M. Saadia, Int. J. Biomed. Sci., 2011, 7(2), 137-144.
- M.A.A.Z. Mohammad, N.H. El-Anwar, F. Mohammad Aly, S. Mohammad El-Moghazy, Chem. Pharm. Bull., 2007, 55(1), 1-6.
- M.M.E.S. Sebaiy, A.A. El-Adl, M. Sobhy, A. Aziz, L.M. Hashem, A. Hisham, Asian J. Pharm. Anal., 2011, 1(4), 79-84.
- R.G. Brereton, Analyst., 1997, 122(12), 1521-1529.
- N.T. Lamie, Spectrochim. Acta A., 2015, 141, 193-201.
- A. Afkhami, M. Bahram, Talanta., 2005, 66(3), 712-720.
- A. Afkhami, M. Bahram, Talanta., 2006, 68(4), 1148-1155.
- M.M. Abdelrahman, Spectrochimica Acta Part A., 2013, 113, 291-296.
- D.L. Massart, B. Vandeginste, S. Deming, Y. Michotte, L. Kaufman, Chemometrics: A textbook Elsevier Amsterdam Google Scholar, 1988.
- ICH and IQ2(R1): Validation of analytical procedures: text and methodology. In International Conference on Harmonization, Geneva, 2005.
- R.G. Brereton, Analyst., 2000, 125(11), 2125-2154.
- D.M. Haaland, E.V. Thomas, Anal. Chem., 1988, 60(11), 1193-1202.

