Research Article - Der Pharma Chemica ( 2023) Volume 15, Issue 3
A Comparative QSAR Study on Alkyl and Alkoxy Pyrazolo [1, 5-C] Quinazoline-2- Carboxylates as NMDA/Glycine And AMPA Receptor Antagonists
Neelam Khan1* and Javed Khan Pathan22Index Institute of Pharmacy, Malwanchal University, Indore (M.P.), India
Neelam Khan, Amaltas Institute of Pharmacy, Amaltas University, Dewas (M.P.), India, Email: sapphire746@gmail.com
Received: 27-Feb-2023, Manuscript No. dpc-23-90225; Editor assigned: 01-Mar-2023, Pre QC No. dpc-23-90225; Reviewed: 15-Mar-2023, QC No. dpc-23-90225; Revised: 17-Mar-2023, Manuscript No. dpc-23-90225; Published: 24-Mar-2023, DOI: 10.4172/0975-413X.15.3.5-15
Abstract
A Quantitative Structural Relationship study had been performed on Alkyl Alkoxy Pyrazole [1, 5-c] quinazoline-2-carboxylate by using multiple linear regression to identify descriptors, which are actually focusing towards the biological activity. The best predictive QSAR model derived and validated in order to Glutamate receptor models by using a combination of different physicochemical parameters such as steric, electronic and topological. The final QSAR model shows a good predictivity and statistical validation respectively as a NMDA receptor final model had Correlation Coefficient r = 0.928, Square Correlation Coefficient r2 = 0.806, Cross validation Coefficient Q2LOO = 0.685, adjusted correlation coefficient R2adj =0.821, predicted root mean squared error RMSEpred =0.352, predictive residual sum of square S press = 0.352 and standard deviation s= 0.31. On the other hand, the built AMPA generated model had Correlation Coefficient r = 0.927, Square Correlation Coefficient R2 = 0.859, Cross validation Coefficient Q2LOO =0.747, adjusted correlation coefficient R2adj = 0.823, Predicted root mean squared error RMSE pred =0.344, Predictive residual sum of squares Spress =0.465and standard deviation s= 0.30. It was observed that the glutamate receptor (NMDA/AMPA) had a lipophilic, steric volume and electron withdrawing descriptors were crucial in imparting higher potency to NMDA Glycine and AMPA receptor.
The obtained result reveals the good predicting the inhibitory potential of the NMDA/AMPA conjugates of new molecules with more accuracy.
Keywords
Quantitative structure activity relationship (QSAR); NMDA/Gly; AMPA receptor; Multiple linear regressions (MLR)
INTRODUCTION
The glutamatergic system plays a very important role in the operation of the mammalian central nervous system and the pathogenesis of many neurological and neurodegenerative disease [1].
L-Glutamate is the major excitatory neurotransmitter in the mammalian CNS, and plays very impotant role in the neuronal communication to neuropathology. It is the primary mediators of excitatory synaptic transmission in the brain [2] α- amino -3- hydroxyl-5-methyl -4-isoxazolepropionic acid receptor (AMPARs), in conjunction with other ionotropic glutamate receptor (iGLuR) family members, N-methyl- D-aspartate receptors and kainite receptors (NMDARs and KARs), are cation permeable receptor. The AMPARs also act as one of the ostiary of NMDAR-dependent synaptic plasticity by relieving their voltage-dependent channel block by Mg2+ [3,4], allowing the postsynaptic Ca2+ entry that initiates changes in synaptic strength [5-7]. At some synapses, AMPARs can also mediate calcium influx directly, triggering various forms of postsynaptic plasticity [8,9].
In this paper, NMDA and AMPA receptors is described as potential targets for neurodegenerative therapeutic intervention. A different series of compound with inhibitory activity toward AMPA and NMDA receptor have been elaborated. It has been reported that compound showing high affinity for both AMPA and NMDA binding sites are more potent antagonist than the compound having selective affinity toward AMPA/NMDA receptor [10-12]. Thus AMPA and NMDA receptor can be considered as the prospective target for therapeutic prevention of CNS neurotransmission or neuronal degeneration in neurological disorders including phenylcyclidine (PCP) and ketamine project against brain damage in neurological disorder such as stroke Alzheimer’s, Parkinson’s, and Huntington’s [13-16]. However, these agents have psychotomimetic properties in humans. Thus, it may be possible to prevent the unwanted side effect of NMDA/AMPA antagonist, thereby escalating their utility as neuroprotectives.
So, we proposed an approach for increasing the potency of ligands towards both receptor subtypes (AMPA and NMDA) that may help in the development of potential anticonvulsant agents or neurodegenerative agents.
Quantitative structure Activity Relationship (QSAR) is an important role rational design of drug in drug discovery to identify new inhibitors. QSAR study imparts fact relating structural physicochemical parameter and steric properties or certain structural feature of structurally similar drug molecules. It makes an effort to establish the correlation between the experimental activity of a set of compound and their chemical structure as defined by various molecular descriptors using various regression-based statistical method such as Multiple Linear Regressions (MLR), and Partial Least Squares (PLS) [17].
In this work proposed a predictive QSAR model based on data analysis method (multiple linear regressions – MLR analysis), accomplish about the model of interaction and to improve the activity at this receptor which is validated with cross validation method-CV, Y- Scrambling and spreadability.
MATERIALS AND METHODS
In designing new drugs, compound selection and optimization is on the basis of Biological activity estimation forms. Although various experimental approaches are available for screening the biological activity of compound, they are in some way very expensive and time consuming. Quantitative structure activity relationship (QSAR) analysis provides an essential and powerful tool for achieving the same goal with modest cost. In search of novel molecule of glutamate receptor antagonist (NMDA/AMPA) pertains assorted statistical method to prospect the pivotal structural properties of the compound that are related with their NMDA/AMPA inhibitory activities. QSAR models were designed for a combined data set of 17 compounds having NMDA/AMPA inhibitory activity, which was explicate form the literature [18]. The predictability and validated performance of the proposed model were vindicate using internal (cross- validation and Y-scrambling) and statistical validations. The multiple linear regression analysis based self-generated QSAR software.
Biological activity dataset and selection of molecules for analysis
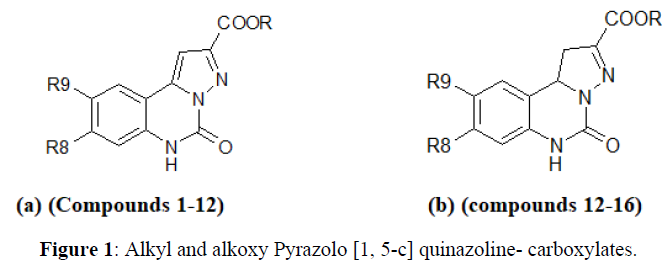
The series of compound subjected to QSAR analysis was Alkyl Alkoxy Pyrazolo [1, 5- c] quinazoline-2-carboxylates at Glycine/NMDA and AMPA receptor antagonist studied by Catarzi D. et.al. The series is compound are listed in Table 1. In this table, Ki refers to the concentration of compound producing inhibition of [3H] glycine and AMPA binding. On this series the QSAR was performed both Glycine and AMPA receptor.
Statistical Parameters and Model validation
Statistical parameters are measure of the potential contribution of its group to particular properties of the parent compound and evaluation of model had the number of compound in Regression (n), the correction (r), square of correlation coefficient (R2), Fisher test (F), the Fischer reveals the ration of the variance explained by model and variance due to the error in the regression. High value of F- test indicates that the model is statistically significant. Validation parameter, the validity of QSAR model depends partly on its goodness- of- fit, robustness and predictivity. The cross validated correlation coefficient Q2cv is the most commonly used technique for internal validation. The regression coefficient R2 is a relative measure of fit by the regression equation. It depicts the part of the variation in observed data that is explained by the regression. Predictive R2 (R2pred) was calculated for evaluating predictive capacity of the model [19]. The value of R2 pred > 0.5 indicates the predictive capacity of the QSAR model. All the squared differences between the true response and the predicted response of the compounds in the training set are expressed in the predictive residual sum of square (PRESS). Y randomization technique ensures the robustness of a QSAR model.
Calculation of molecular descriptors
The molecular descriptors were calculated for the ligand dataset using self-generated QSAR software. vander waals volume (Vw) and indicator parameters (I) were computed.
RESULTS AND DISCUSSION
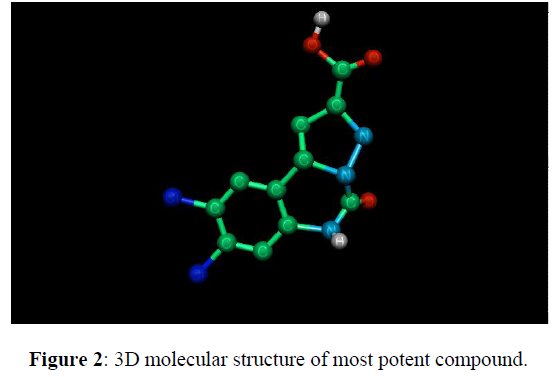
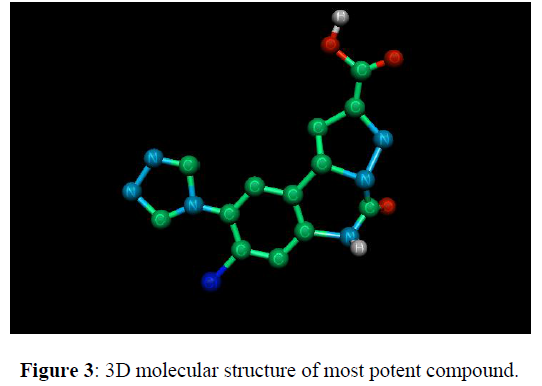
Using Hansch approach, we correlated the activity of Alkyl Alkoxy Pyrazolo [1, 5- c] quinazoline-2-carboxylates at Glycine /NMDA and AMPA receptor antagonists through multiple linear regressions. Following validated statistical result and equation evaluated in order to individual receptors e.g. AMPA and NMDA/Glycine (Figures 1-3).
8, 9-Dichloro-5, 6-Dihydro-5-oxo-pyrazolo [1, 5-c] quinazoline-2-carboxylic Acid at glycine site compound (16) in Table 1
8-chloro-5, 6-dihydro-9-(pyrrol-1-yl) –5-oxo-pyrazolo [1, 5-c] quinazoline-2-carboxylic Acid at AMPA site compound (10) in Table 1.
| Comp. No. |
R | R8 | R9 | Ki(mM) [3H] glycine | Ki(μ) [3H] AMPA |
|---|---|---|---|---|---|
| 1 | Et | H | H | 33.3 ± 7 | 42 ± 6.8 |
| 2 | H | H | H | 1.41 ± 0.3 | 12.4 ± 2.5 |
| 3 | Et | Cl | H | 26.5 ± 4.4 | 72 ± 2.3 |
| 4 | H | Cl | H | 0.48 ± 0.04 | 2.3 ± 0.4 |
| 5 | Et | Cl | NO2 | 10.6 ± 1.8 | 26 ±9 |
| 6 | H | Cl | NO2 | 1.1 ± 0.1 | 8.2 ± 2 |
| 7 | Me | Cl | Cl | 1.3 ± 0.2 | 0.74 ± 0.04 |
| 8 | H | Cl | Cl | 0.16 ± 0.04 | 2.4 ± 0.8 |
| 9 | Et | Cl |
|
- | 0.87 ± 0.18 |
| 10 | H | Cl |  |
8.3 ± 2.0 | 0.14 ± 0.02 |
| 11 | Et | Cl |  |
57 ± 9 | 1.4 ± 0.2 |
| 12 | H | Cl |  |
8.2 ± 3 | 0.27 ± 0.02 |
| 13 | H | H | H | 2.0 ± 0.4 | 96 ± 8 |
| 14 | Me | Cl | H | 10.6 ± 3.9 | 17.3 ± 4.1 |
| 15 | H | Cl | H | 0.24 ± 0.03 | 7.2 ± 0.6 |
| 16 | Me | Cl | Cl | 4.0 ± 1.0 | 8.5 ± 1.3 |
| 17 | H | Cl | Cl | 0.19 ± 0.02 | 2.65 ± 0.48 |
At NMDA/Glycine site
In following Table 2, it has been studied with various physicochemical, electrical and steric parameters. After many trials Equation 1 was found to be promising.
| Com.No. | R9 Vw | R9I | RI | Obs-logIC50 | Cal -logIC50 |
Cal. Resid |
Pred. -logIC50 |
Pred. resid | Lev (0.75) |
|---|---|---|---|---|---|---|---|---|---|
| 1 | 0.056 | 0 | 0 | -1.522 | -1.159 | -0.363 | -1.051 | -0.471 | 0.227 |
| 2 | 0.056 | 0 | 1 | -0.149 | 0.04 | -0.189 | 0.082 | -0.231 | 0.188 |
| 3 | 0.056 | 0 | 0 | -1.423 | -1.159 | -0.264 | -1.081 | -0.342 | 0.227 |
| 4 | 0.056 | 0 | 1 | 0.318 | 0.04 | 0.278 | -0.024 | 0.342 | 0.188 |
| 5 | 0.276 | 0 | 0 | -1.025 | -0.618 | -0.407 | -0.472 | -0.553 | 0.265 |
| 6 | *0.276 | 0 | 1 | -0.041 | 0.58 | -0.621 | 0.813 | -0.854 | 0.272 |
| 7 | 0.244 | 0 | 0 | -0.113 | -0.697 | 0.584 | -0.854 | 0.741 | 0.212 |
| 8 | 0.244 | 0 | 1 | 0.795 | 0.501 | 0.294 | 0.421 | 0.374 | 0.213 |
| 9 | 0.76 | 1 | 1 | -0.919 | -0.834 | -0.085 | -0.785 | -0.134 | 0.362 |
| 10 | 0.783 | 1 | 0 | -1.755 | -1.976 | 0.221 | -2.155 | 0.4 | 0.447 |
| 11 | 0.783 | 1 | 1 | -0.913 | -0.777 | -0.136 | -0.699 | -0.214 | 0.363 |
| 12 | 0.056 | 0 | 1 | -0.301 | 0.04 | -0.341 | 0.117 | -0.418 | 0.188 |
| 13 | 0.056 | 0 | 0 | -1.025 | -1.159 | 0.134 | -1.197 | 0.172 | 0.227 |
| 14 | 0.056 | 0 | 1 | 0.619 | 0.04 | 0.579 | -0.094 | 0.713 | 0.188 |
| 15 | 0.244 | 0 | 0 | -0.602 | -0.697 | 0.095 | -0.722 | 0.12 | 0.212 |
| 16 | 0.244 | 0 | 1 | 0.721 | 0.501 | 0.22 | 0.441 | 0.28 | 0.213 |
-logIC50 = 2.457(2.415)R9Vw -2.603(1.619)R9I +1.198(0.440)RI -1.296(0.504)
n = 16 r = 0.900 s = 0.355 F = 17.040………………………….. (1)
William’s Plot
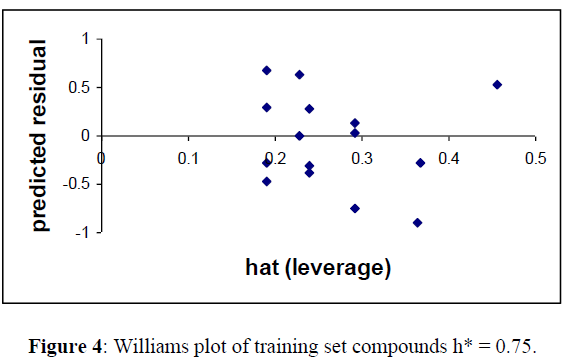
For detecting the outliers in the training set, applicability domain of the model was analyzed by the William plot. One data points (6) was not included in finalizing the model for training set in Table (2) as they were outside the cut off value of Y space (Figure 4).
-logIC50 = 3.352(2.363)R9Vw -3.245(1.602)R9I +1.312(0.412)RI -1.424(0.471)
n = 15 r = 0.928 s = 0.312 F = 22.620...................................(2)
R2 = 0.806, Q2LOO =0.685, R2adj = 0.821, RMSE pred =0.352 Spress =0.352
The resultant equation (2) indicated good r = 0.928, low s = 0.312 and high F = 22.62 Equation (2) was checked for the importance of each parameter by eliminating them one at a time and generating the resultant equation. The resultant equations were checked for their statistical validity (Table 3,4).
| S.N. | R9 Vw | R9I | RI | Obs-logIC50 | Cal. -logIC50 |
Cal. Resid |
Pred.-logIC50 | Pred. residual |
|---|---|---|---|---|---|---|---|---|
| 1 | 0.056 | 0 | 0 | -1.522 | -1.236 | -0.286 | -1.146 | -0.376 |
| 2 | 0.056 | 0 | 1 | -0.149 | 0.076 | -0.225 | 0.128 | -0.277 |
| 3 | 0.056 | 0 | 0 | -1.423 | -1.236 | -0.187 | -1.117 | -0.306 |
| 4 | 0.056 | 0 | 1 | 0.318 | 0.076 | 0.242 | 0.018 | 0.3 |
| 5 | 0.276 | 0 | 0 | -1.025 | -0.499 | -0.526 | -0.281 | -0.744 |
| 6 | 0.244 | 0 | 0 | -0.113 | -0.606 | 0.493 | -0.752 | 0.639 |
| 7 | 0.244 | 0 | 1 | 0.795 | 0.706 | 0.089 | 0.668 | 0.127 |
| 8 | 0.76 | 1 | 1 | -0.919 | -0.81 | -0.109 | -0.022 | -0.897 |
| 9 | 0.783 | 1 | 0 | -1.755 | -2.045 | 0.29 | -2.287 | 0.532 |
| 10 | 0.783 | 1 | 1 | -0.913 | -0.733 | -0.18 | -0.627 | -0.286 |
| 11 | 0.056 | 0 | 1 | -0.301 | 0.076 | -0.377 | 0.163 | -0.464 |
| 12 | 0.056 | 0 | 0 | -1.025 | -1.236 | 0.211 | -1.302 | 0.277 |
| 13 | 0.056 | 0 | 1 | 0.619 | 0.076 | 0.543 | -0.052 | 0.671 |
| 14 | 0.244 | 0 | 0 | -0.602 | -0.606 | 0.004 | -0.607 | 0.005 |
| 15 | 0.244 | 0 | 1 | 0.721 | 0.706 | 0.015 | 0.698 | 0.023 |
| R9Vw | R9I | RI | |
|---|---|---|---|
| R9Vw | 1.000 | 0.947 | 0.068 |
| R9I | 1.000 | 0.134 | |
| RI | 1.000 |
Correlation Matrix
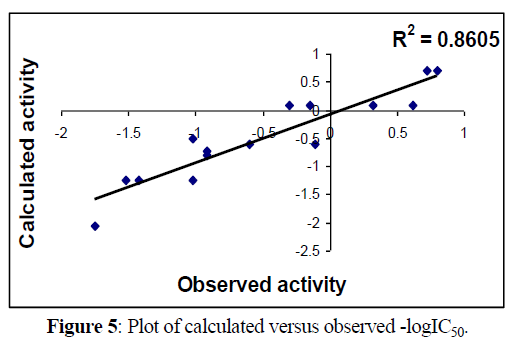
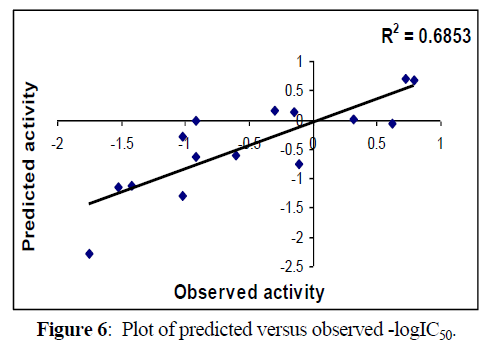
Following figures 5,6 shows Regression lines of the cross-validated QSAR equation (2).
Randomization Test: Y- Scrambling
The proposed models are also checked for reliability and robustness by Y- scrambling: new model are calculated for randomly recorded response (mean R2 value in 10 time iteration). The robustness of the QSAR models for experimental training sets was examined by comparing these models to those derived for random data sets. Random set generated by rearranging biological activities of the training set molecules (Table 5).
| Iterations | R2 |
|---|---|
| 1 | 0.216 |
| 2 | 0.27 |
| 3 | 0.023 |
| 4 | 0.186 |
| 5 | 0.027 |
| 6 | 0.047 |
| 7 | 0.228 |
| 8 | 0.249 |
| 9 | 0.22 |
| 10 | 0.278 |
| SUM | 1.744 |
| Mean | 0.1744 |
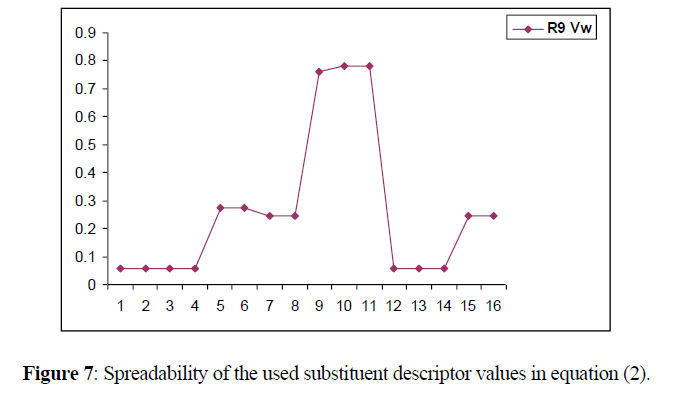
Spreadability of descriptor
The descriptors selected for generating the model spread through a wide range, which is indicated in the following Figure 7. A good spreadability of the descriptor values of the substituents reduces bias in the QSAR equation and makes the activity prediction power of the model much more accurate (Figure 7).
At AMPA site
Moreover Multiple linear regression using Hansch analysis, we correlated the activity of Alkyl Alkoxy Pyrazolo [1, 5- c] quinazoline-2- carboxylates at AMPA receptor (Table 6).
| Comp.no. | R9Vw | RI | R8I | Obs-logIC50 | Cal. -logIC50 |
Cal. Residual |
Pred-logIC50 | Pred residual |
leverage (0.70) |
|---|---|---|---|---|---|---|---|---|---|
| 1 | 0.056 | 0 | 0 | -1.623 | -1.839 | 0.216 | -1.937 | 0.314 | 0.313992 |
| 2 | 0.056 | 1 | 0 | -1.093 | -1.428 | 0.335 | -1.577 | 0.484 | 0.310207 |
| 3 | 0.056 | 0 | 1 | -1.857 | -1.213 | -0.644 | -1.016 | -0.841 | 0.235035 |
| 4 | 0.056 | 1 | 1 | -0.361 | -0.802 | 0.441 | -0.909 | 0.548 | 0.196284 |
| 5 | 0.276 | 0 | 0 | -1.414 | -1.418 | 0.004 | -1.419 | 0.005 | 0.327813 |
| 6 | 0.276 | 1 | 1 | -0.913 | -0.381 | -0.532 | -0.3 | -0.613 | 0.130393 |
| 7* | 0.276 | 0 | 1 | 0.13 | -0.792 | 0.922 | -0.96 | 1.09 | 0.154004 |
| 8 | 0.244 | 1 | 1 | -0.38 | -0.442 | 0.062 | -0.451 | 0.071 | 0.13466 |
| 9 | 0.76 | 0 | 1 | 0.06 | 0.134 | -0.074 | 0.162 | -0.102 | 0.27692 |
| 10 | 0.76 | 1 | 1 | 0.853 | 0.546 | 0.307 | 0.422 | 0.431 | 0.286617 |
| 11 | 0.783 | 0 | 1 | -0.146 | 0.178 | -0.324 | 0.312 | -0.458 | 0.293068 |
| 12 | 0.783 | 1 | 1 | 0.568 | 0.59 | -0.022 | 0.598 | -0.03 | 0.304348 |
| 13 | 0.056 | 1 | 0 | -1.982 | -1.428 | -0.554 | -1.178 | -0.804 | 0.310207 |
| 14 | 0.056 | 0 | 1 | -1.238 | -1.213 | -0.025 | -1.206 | -0.032 | 0.235035 |
| 15 | 0.056 | 1 | 1 | -0.857 | -0.802 | -0.055 | -0.788 | -0.069 | 0.196284 |
| 16 | 0.244 | 0 | 1 | -0.929 | -0.854 | -0.075 | -0.839 | -0.09 | 0.160472 |
| 17 | 0.244 | 1 | 1 | -0.423 | -0.442 | 0.019 | -0.444 | 0.021 | 0.13466 |
l = 1.914(0.878) R9 Vw + 0.412 (0.455)RI +0.626(0.575)R8I -1.946(0.532)
n = 17 r = 0.880 s = 0.390 F = 14.931…………………..(3)
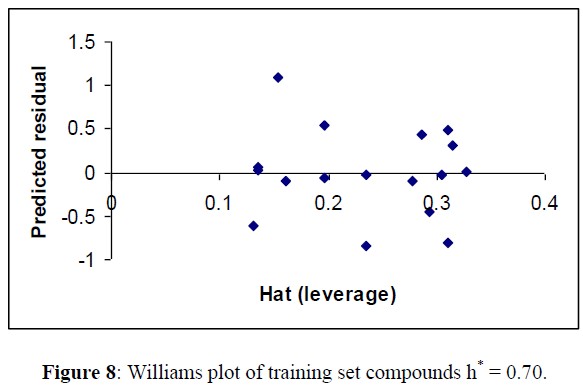
William’s Plot
For detecting the outliers in the training set, applicability domain of the model was analyzed by the William plot. One data point (7) in Table 6 were not included in finalizing the model for training set in Table 6 as they were outside the cut off value of Y space (Figure 8).
-logIC50 = 2.009(0.709)R9v +0.554(0.381)RI +0.513(0.470)R8I -2.028(0.431)
n = 16 r = 0.927 s = 0.308 F = 24.381....................................(4)
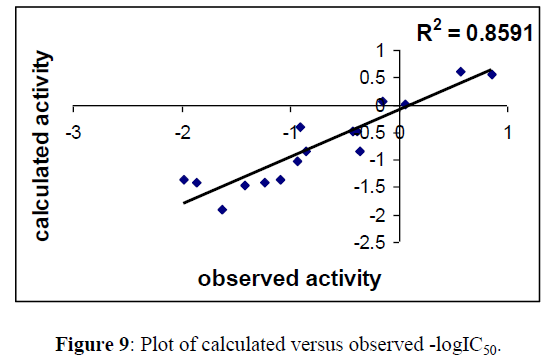
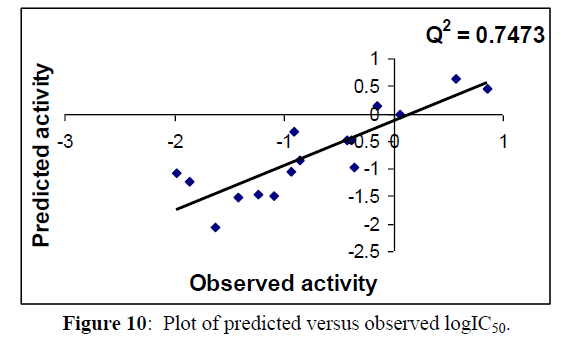
R2 = 0.859, Q2LOO =0.747, R2adj = 0.823 RMSE pred. =0.344 Spress =0.465 (Tables 7,8)
Regression lines of the cross-validated QSAR equation (15) (Figures 9,10).
Table 3 &7 gives the observed, calculated and LOO biological activities of compounds in Table 1. Moreover Table 4 & 8 gives the inter correlation matrix of the descriptors used in equation 2 & 4.
Fig 5, 6 & 9, 10 indicates the closeness of the observed with calculated and predicted -logIC50 respectively (obtained from equation 2 & 4), which indicates the accuracy of the model.
| Comp. No. |
R9Vw | RI | R8I | Obs-logIC50 | Cal. -logIC50 |
Cal. Residual |
Pred-logIC50 | Pred residual |
|---|---|---|---|---|---|---|---|---|
| 1 | 0.056 | 0 | 0 | -1.623 | -1.915 | 0.292 | -2.052 | 0.429 |
| 2 | 0.056 | 1 | 0 | -1.093 | -1.362 | 0.269 | -1.484 | 0.391 |
| 3 | 0.056 | 0 | 1 | -1.857 | -1.402 | -0.455 | -1.233 | -0.624 |
| 4 | 0.056 | 1 | 1 | -0.361 | -0.848 | 0.487 | -0.969 | 0.608 |
| 5 | 0.276 | 0 | 0 | -1.414 | -1.473 | 0.059 | -1.502 | 0.088 |
| 6 | 0.276 | 1 | 1 | -0.913 | -0.406 | -0.507 | -0.33 | -0.583 |
| 7 | 0.244 | 1 | 1 | -0.38 | -0.47 | 0.09 | -0.485 | 0.105 |
| 8 | 0.76 | 0 | 1 | 0.06 | 0.012 | 0.048 | -0.007 | 0.067 |
| 9 | 0.76 | 1 | 1 | 0.853 | 0.566 | 0.287 | 0.45 | 0.403 |
| 10 | 0.783 | 0 | 1 | -0.146 | 0.058 | -0.204 | 0.148 | -0.294 |
| 11 | 0.783 | 1 | 1 | 0.568 | 0.612 | -0.044 | 0.632 | -0.064 |
| 12 | 0.056 | 1 | 0 | -1.982 | -1.362 | -0.62 | -1.076 | -0.906 |
| 13 | 0.056 | 0 | 1 | -1.238 | -1.402 | 0.164 | -1.462 | 0.224 |
| 14 | 0.056 | 1 | 1 | -0.857 | -0.848 | -0.009 | -0.845 | -0.012 |
| 15 | 0.244 | 0 | 1 | -0.929 | -1.024 | 0.095 | -1.046 | 0.117 |
| 16 | 0.244 | 1 | 1 | -0.423 | -0.47 | 0.047 | -0.478 | 0.055 |
| R9Vw | RI | R8I | |
|---|---|---|---|
| R9Vw | 1.000 | -0.065 | 0.376 |
| RI | 1.000 | 0.073 | |
| R8I | 1.000 |
| iteration | R2 |
|---|---|
| 1 | 0.16 |
| 2 | 0.112 |
| 3 | 0.315 |
| 4 | 0.157 |
| 5 | 0.089 |
| 6 | 0.064 |
| 7 | 0.35 |
| 8 | 0.176 |
| 9 | 0.131 |
| 10 | 0.141 |
| SUM | 1.695 |
| Mean | 0.1695 |
Spreadability of descriptor
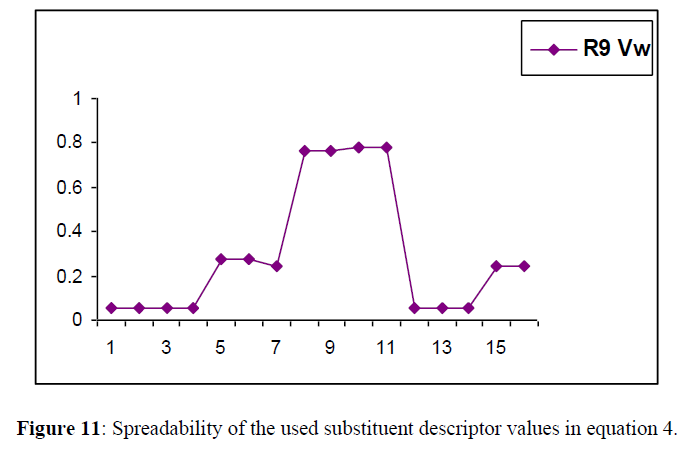
The descriptors selected for generating the model spread through a wide range, which is indicated in Figure11. A good spreadability of the descriptor values of the substituents reduces bias in the QSAR equation and makes the activity prediction power of the model much more accurate.
The descriptor selected for generating the model spread through a wide range, which is indicated in Figure 11.
Receptor Mapping
Alkyl Alkoxy Pyrazolo [1, 5- c] quinazoline-2-carboxylates at Glycine\NMDA receptor and AMPA receptor (Figures 12,13).
Proposed model shows interaction of Alkyl Alkoxy Pyrazolo [1, 5- c] quinazoline-2-carboxylate with NMDA/Glycine receptor. L2 is small lipophilic pocket and indicates a steric site in the receptor. D1H+ and D2H+ are proton donors.
Furthermore Receptor mapping of the model Alkyl Alkoxy Pyrazolo [1, 5- c] quinazoline-2-carboxylate at AMPA shows presence of lipophilic pocket L1 and L2 and D1H+ and D2H+ indicate proton donor sites in the receptor.
CONCLUSION
The QSAR studied on the series of alkyl alkoxy pyrazole quinazoline carboxylate compounds revealed that the presence of functional group that balance the electron donar and liphophilicity would lead to accelerate in the activity of alkyl alkoxy pyrazole quinazoline carboxylate derivatives against dual NMDA/Gly and AMPA receptor. The final model depicted that the presence of electron withdrawing group at pyrazole quinazolines enhances the activity. Steric parameter vander waals volume and lipophilic element L1 and L2 parameters contributing towards biological activity and good affinity predictability with respect to both receptors. These models could give reasonably good prediction of binding affinity and robustness of model rather than individual model.
The cross validated method, Y randomization techniques indicated that the model and statistically significant and has good internal and external predictability.
Finally it concluded that to develop a good and predicted QSAR analysis, MLR is carried out using two or more descriptors depending on the number of observation in the dual activity data set (NMDA/AMPA) in order to obtain a better predictive model avoiding chance of counterfeit correlation. Both NMDA and AMPA receptors were screen out which may potential lead for the neurodegenerative disorder.
REFERENCES
- Cotman CW, Kahle JS, Miller SE, et al., In Psychopharmacology. The fourth generation of progress; Bloom, Ed.; Raven Press Ltd.; New York, 1995.
- Wollmuth LP, Chris J Mc Bain CJ, Frank S Menniti FS, et al., Pharmacol Rev. 2010, 62(3): p. 405-496.
- Mayer ML, Westbrook GL, Guthrie PB. Nature. 1984, 309 (5965): p. 261-263.
- Nowak L, Bregestovski P, Ascher P, et al., Nature. 1987, 307: p. 462-465
- Bliss TV, Collingridge GL. Nature. 1993, 361(6407): p. 31-39.
- Huganir RL, Nicoll RA. Nature. 2013, 80(3): p. 704-717.
- Kessels HW, Malinow R. Nature. 2009, 61(3): p. 340-350.
- Candy SC, Kelly L, Farrant M. Curr Opin Neurobiology. 2006, 16(3): 288-297.
- Liu SJ, Zukin RS. Trends Neurosci. 2007, 30(3): p. 126-134.
- Löscher W. Prog Neurobiol. 1998, 54: p. 721.
- Löscher W, Lehmann H, Behl B, et al., Eur J Neurosci. 1999, 11: p. 250.
- Auberson YP. Drugs Fut. 2001, 26: p. 463.
- Choi DW. Neuron. 1998, 1: p. 623-634.
- Choi DW. Prog Brain Res. 1994, 100: p. 47-51.
- Choi DW. Trends Neurosci. 1995, 18: p. 58-60.
- Rothman SM, Onley JW. Trends Neurosci. 1995, 18: p. 57-58.
- Rudrapal M., Chetia D. Current trends in pharmaceutical research. 2016, 3(1): p. 1-7.
- Varano F, Catarzi D, Colotta V, et al., J Med Chem. 2002, 45: p. 1035- 1044.
- Kandakatla N, Ramakrishnan G, Vadivelan S, et al. International J PharmTech Research. 2012, 4(3): p. 1110-1121. Google Scholar
Indexed at, Google Scholar, Crossref
Indexed at, Google Scholar, Crossref
Indexed at, Google Scholar, Crossref
Indexed at, Google Scholar, Crossref
Indexed at, Google Scholar, Crossref
Indexed at, Google Scholar, Crossref
Indexed at, Google Scholar, Crossref
Indexed at, Google Scholar, Crossref
Indexed at, Google Scholar, Crossref
Indexed at, Google Scholar, Crossref
Indexed at, Google Scholar, Crossref
Indexed at, Google Scholar, Crossref
Indexed at, Google Scholar, Crossref
Indexed at, Google Scholar, Crossref
Indexed at, Google Scholar, Crossref
Indexed at, Google Scholar, Crossref

